You can run this notebook in ![]() , in
, in ![]() , in
, in ![]() or in
or in  .
.
[1]:
!pip install --quiet climetlab
[2]:
import climetlab as cml
[3]:
source = cml.load_source("cds",
        'insitu-observations-gruan-reference-network',
        variable= 'air_temperature',
        year= '2017',
        month= '01',
        day=['01', '02', '03',
            '04', '05', '06',
            '07', '08', '09',
            '10', '11', '12',
            '13', '14', '15',
            '16', '17', '18',
            '19', '20', '21',
            '22', '23', '24',
            '25', '26', '27',
            '28', '29', '30',
            '31',],
        format= 'csv-lev.zip')
[4]:
df = source.to_pandas()
[5]:
df
[5]:
| station_name | report_timestamp | time_since_launch | report_id | longitude | latitude | height_of_station_above_sea_level | air_pressure | air_pressure_total_uncertainty | air_temperature | |
|---|---|---|---|---|---|---|---|---|---|---|
| 0 | LIN | 2017-01-01 00:00:00+00:00 | 0.00000 | 242982 | 14.1203 | 52.2094 | 103.8 | 101096.00 | 36.8895 | 274.357 |
| 1 | LIN | 2017-01-01 00:00:00+00:00 | 1.00000 | 242982 | 14.1203 | 52.2094 | 103.8 | 101019.00 | 36.8886 | 274.321 |
| 2 | LIN | 2017-01-01 00:00:00+00:00 | 2.00000 | 242982 | 14.1204 | 52.2094 | 103.8 | 100946.00 | 36.8878 | 274.282 |
| 3 | LIN | 2017-01-01 00:00:00+00:00 | 3.00012 | 242982 | 14.1204 | 52.2095 | 103.8 | 100879.00 | 36.8870 | 274.255 |
| 4 | LIN | 2017-01-01 00:00:00+00:00 | 4.00012 | 242982 | 14.1204 | 52.2095 | 103.8 | 100810.00 | 36.8861 | 274.257 |
| ... | ... | ... | ... | ... | ... | ... | ... | ... | ... | ... |
| 1645953 | LIN | 2017-01-31 18:00:00+00:00 | 5002.16000 | 246127 | 14.3240 | 51.9910 | 103.8 | 2354.49 | 37.2003 | 198.804 |
| 1645954 | LIN | 2017-01-31 18:00:00+00:00 | 5003.16000 | 246127 | 14.3247 | 51.9909 | 103.8 | 2352.38 | 37.1999 | 198.776 |
| 1645955 | LIN | 2017-01-31 18:00:00+00:00 | 5004.16000 | 246127 | 14.3253 | 51.9909 | 103.8 | 2350.24 | 37.1994 | 198.747 |
| 1645956 | LIN | 2017-01-31 18:00:00+00:00 | 5005.16000 | 246127 | 14.3260 | 51.9908 | 103.8 | 2347.39 | 37.1988 | 198.710 |
| 1645957 | LIN | 2017-01-31 18:00:00+00:00 | 5006.16000 | 246127 | 14.3267 | 51.9907 | 103.8 | 2344.79 | 37.1982 | 198.670 |
1645958 rows × 10 columns
[6]:
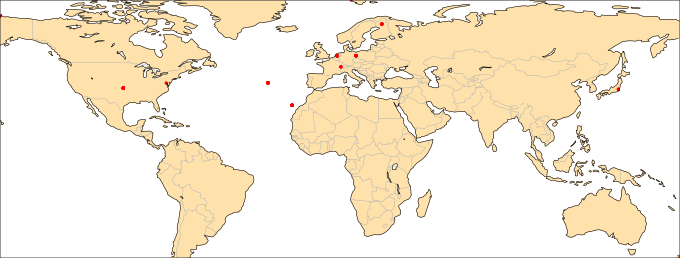
cml.plot_map(df[(df.time_since_launch==0)])