You can run this notebook in ![]() , in
, in ![]() , in
, in ![]() or in
or in  .
.
[1]:
!pip install --quiet climetlab
Retrieve ERA5 data from the CDS
[2]:
import climetlab as cml
[6]:
source = cml.load_source(
"cds",
"reanalysis-era5-single-levels",
variable=["2t", "msl"],
product_type="reanalysis",
area=[50, -50, 20, 50],
date="2012-12-12",
time="12:00",
)
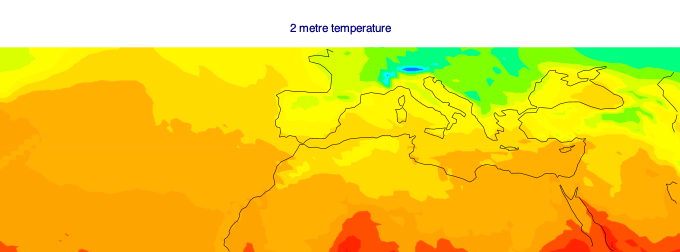
for s in source:
cml.plot_map(s)


[8]:
source = cml.load_source(
"cds",
"reanalysis-era5-single-levels",
variable=["2t", "msl"],
product_type="reanalysis",
area=[50, -50, 20, 50],
date="2012-12-12",
time="12:00",
format="netcdf",
)
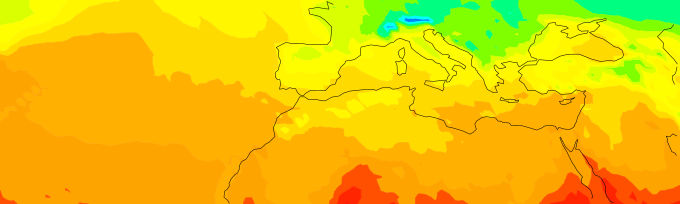
for s in source:
cml.plot_map(s)
[10]:
source.to_xarray()
[10]:
<xarray.Dataset>
Dimensions:    (latitude: 121, longitude: 401, time: 1)
Coordinates:
  * longitude  (longitude) float32 -50.0 -49.75 -49.5 -49.25 ... 49.5 49.75 50.0
  * latitude   (latitude) float32 50.0 49.75 49.5 49.25 ... 20.5 20.25 20.0
  * time       (time) datetime64[ns] 2012-12-12T12:00:00
Data variables:
    t2m        (time, latitude, longitude) float32 274.3 274.4 ... 302.2 302.5
    msl        (time, latitude, longitude) float32 9.956e+04 ... 1.013e+05
Attributes:
    Conventions:  CF-1.6
    history:      2021-03-22 10:05:13 GMT by grib_to_netcdf-2.16.0: /opt/ecmw...
xarray.Dataset
- latitude: 121
- longitude: 401
- time: 1
- longitude(longitude)float32-50.0 -49.75 -49.5 ... 49.75 50.0
- units :
- degrees_east
- long_name :
- longitude
array([-50. , -49.75, -49.5 , ..., 49.5 , 49.75, 50. ], dtype=float32)
- latitude(latitude)float3250.0 49.75 49.5 ... 20.5 20.25 20.0
- units :
- degrees_north
- long_name :
- latitude
array([50. , 49.75, 49.5 , 49.25, 49. , 48.75, 48.5 , 48.25, 48. , 47.75, 47.5 , 47.25, 47. , 46.75, 46.5 , 46.25, 46. , 45.75, 45.5 , 45.25, 45. , 44.75, 44.5 , 44.25, 44. , 43.75, 43.5 , 43.25, 43. , 42.75, 42.5 , 42.25, 42. , 41.75, 41.5 , 41.25, 41. , 40.75, 40.5 , 40.25, 40. , 39.75, 39.5 , 39.25, 39. , 38.75, 38.5 , 38.25, 38. , 37.75, 37.5 , 37.25, 37. , 36.75, 36.5 , 36.25, 36. , 35.75, 35.5 , 35.25, 35. , 34.75, 34.5 , 34.25, 34. , 33.75, 33.5 , 33.25, 33. , 32.75, 32.5 , 32.25, 32. , 31.75, 31.5 , 31.25, 31. , 30.75, 30.5 , 30.25, 30. , 29.75, 29.5 , 29.25, 29. , 28.75, 28.5 , 28.25, 28. , 27.75, 27.5 , 27.25, 27. , 26.75, 26.5 , 26.25, 26. , 25.75, 25.5 , 25.25, 25. , 24.75, 24.5 , 24.25, 24. , 23.75, 23.5 , 23.25, 23. , 22.75, 22.5 , 22.25, 22. , 21.75, 21.5 , 21.25, 21. , 20.75, 20.5 , 20.25, 20. ], dtype=float32) - time(time)datetime64[ns]2012-12-12T12:00:00
- long_name :
- time
array(['2012-12-12T12:00:00.000000000'], dtype='datetime64[ns]')
- t2m(time, latitude, longitude)float32...
- units :
- K
- long_name :
- 2 metre temperature
array([[[274.3189 , 274.44507, ..., 265.422 , 265.4003 ], [274.35568, 274.48853, ..., 265.549 , 265.52728], ..., [298.02753, 297.97656, ..., 301.3438 , 301.54688], [298.1019 , 298.0409 , ..., 302.17184, 302.48853]]], dtype=float32) - msl(time, latitude, longitude)float32...
- units :
- Pa
- long_name :
- Mean sea level pressure
- standard_name :
- air_pressure_at_mean_sea_level
array([[[ 99564.51 ,  99531.76 , ..., 103835.75 , 103847.75 ],
        [ 99660.016,  99627.266, ..., 103797.484, 103809.484],
        ...,
        [101849.03 , 101851.79 , ..., 101350.24 , 101338.   ],
        [101826.98 , 101829.49 , ..., 101323.484, 101310.02 ]]], dtype=float32)
- Conventions :
- CF-1.6
- history :
- 2021-03-22 10:05:13 GMT by grib_to_netcdf-2.16.0: /opt/ecmwf/eccodes/bin/grib_to_netcdf -S param -o /cache/data5/adaptor.mars.internal-1616407511.6256018-2205-2-c901538d-1c41-4559-acd8-eba5cb2f3e3b.nc /cache/tmp/c901538d-1c41-4559-acd8-eba5cb2f3e3b-adaptor.mars.internal-1616407511.6261063-2205-1-tmp.grib
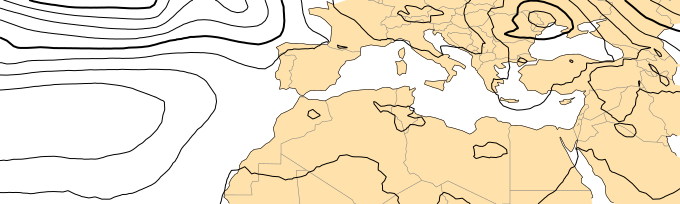
[12]:
cml.plot_map(source.to_xarray(), title=True)