You can run this notebook in ![]() , in
, in ![]() , in
, in ![]() or in
or in  .
.
[1]:
!pip install --quiet climetlab
BUFR data
[2]:
import climetlab as cml
[3]:
source = cml.load_dataset("sample-bufr-data")
[4]:
source
[4]:
sample-bufr-data
| Home page | - |
| Documentation | Sample BUFR file containing TEMP messages |
| Citation | - |
| Licence | - |
See https://github.com/ecmwf/pdbufr
[5]:
pd = source.to_pandas(
    columns=(
        "stationNumber",
        "latitude",
        "longitude",
        "data_datetime",
        "pressure",
        "airTemperature",
    ),
    filters={},
)
[6]:
pd.head()
[6]:
| stationNumber | latitude | longitude | pressure | airTemperature | data_datetime | |
|---|---|---|---|---|---|---|
| 0 | 907 | 58.47 | -78.08 | 100300.0 | 258.3 | 2008-12-08 12:00:00 |
| 1 | 907 | 58.47 | -78.08 | 100000.0 | 259.7 | 2008-12-08 12:00:00 |
| 2 | 907 | 58.47 | -78.08 | 99800.0 | 261.1 | 2008-12-08 12:00:00 |
| 3 | 907 | 58.47 | -78.08 | 99100.0 | 261.7 | 2008-12-08 12:00:00 |
| 4 | 907 | 58.47 | -78.08 | 92500.0 | 258.1 | 2008-12-08 12:00:00 |
[7]:
pd.tail()
[7]:
| stationNumber | latitude | longitude | pressure | airTemperature | data_datetime | |
|---|---|---|---|---|---|---|
| 26191 | 968 | 25.03 | 121.52 | 10000.0 | 197.9 | 2008-12-08 12:00:00 |
| 26192 | 968 | 25.03 | 121.52 | 9520.0 | 196.3 | 2008-12-08 12:00:00 |
| 26193 | 968 | 25.03 | 121.52 | 7000.0 | 201.5 | 2008-12-08 12:00:00 |
| 26194 | 968 | 25.03 | 121.52 | 5000.0 | 209.1 | 2008-12-08 12:00:00 |
| 26195 | 968 | 25.03 | 121.52 | 3000.0 | 217.3 | 2008-12-08 12:00:00 |
[8]:
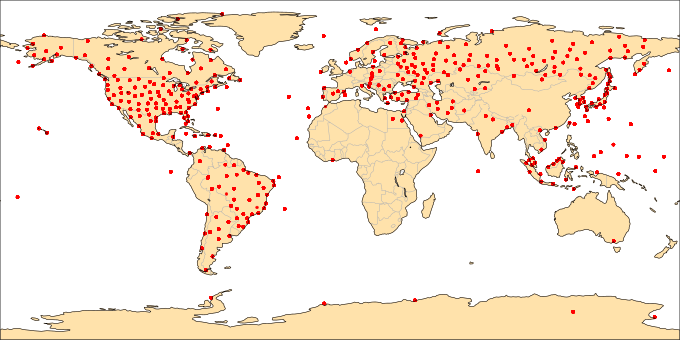
cml.plot_map(pd, projection="global")