You can run this notebook in ![]() , in
, in ![]() , in
, in ![]() or in
or in  .
.
[1]:
!pip install --quiet climetlab
Retrieve data ECMWF MARS archive
[2]:
import climetlab as cml
[3]:
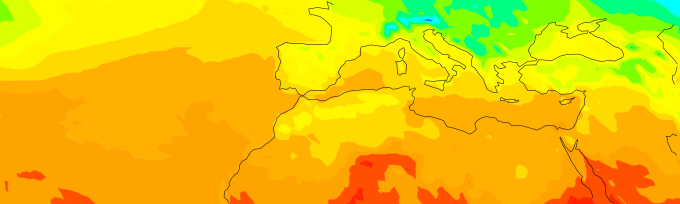
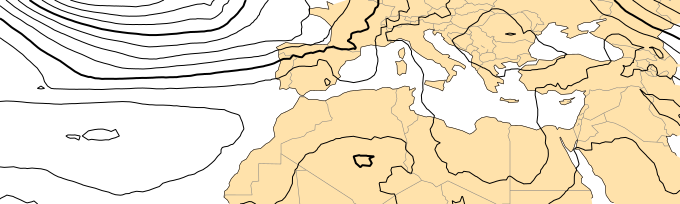
source = cml.load_source(
    "mars",
    param=["2t", "msl"],
    levtype="sfc",
    area=[50, -50, 20, 50],
    grid=[1, 1],
    date="2012-12-13",
)
for s in source:
    cml.plot_map(s)
[4]:
source.to_xarray()
[4]:
<xarray.Dataset>
Dimensions:     (latitude: 31, longitude: 101)
Coordinates:
    number      int64 0
    time        datetime64[ns] 2012-12-13T12:00:00
    step        timedelta64[ns] 00:00:00
    surface     int64 0
  * latitude    (latitude) float64 50.0 49.0 48.0 47.0 ... 23.0 22.0 21.0 20.0
  * longitude   (longitude) float64 -50.0 -49.0 -48.0 -47.0 ... 48.0 49.0 50.0
    valid_time  datetime64[ns] 2012-12-13T12:00:00
Data variables:
    t2m         (latitude, longitude) float32 272.9 274.0 274.7 ... 297.8 298.4
    msl         (latitude, longitude) float32 1.002e+05 9.997e+04 ... 1.014e+05
Attributes:
    GRIB_edition:            1
    GRIB_centre:             ecmf
    GRIB_centreDescription:  European Centre for Medium-Range Weather Forecasts
    GRIB_subCentre:          0
    Conventions:             CF-1.7
    institution:             European Centre for Medium-Range Weather Forecasts
    history:                 2021-03-24T13:23:13 GRIB to CDM+CF via cfgrib-0....
xarray.Dataset
- latitude: 31
- longitude: 101
- number()int64...
- long_name :
- ensemble member numerical id
- units :
- 1
- standard_name :
- realization
array(0)
- time()datetime64[ns]...
- long_name :
- initial time of forecast
- standard_name :
- forecast_reference_time
array('2012-12-13T12:00:00.000000000', dtype='datetime64[ns]') - step()timedelta64[ns]...
- long_name :
- time since forecast_reference_time
- standard_name :
- forecast_period
array(0, dtype='timedelta64[ns]')
- surface()int64...
- long_name :
- original GRIB coordinate for key: level(surface)
- units :
- 1
array(0)
- latitude(latitude)float6450.0 49.0 48.0 ... 22.0 21.0 20.0
- units :
- degrees_north
- standard_name :
- latitude
- long_name :
- latitude
- stored_direction :
- decreasing
array([50., 49., 48., 47., 46., 45., 44., 43., 42., 41., 40., 39., 38., 37., 36., 35., 34., 33., 32., 31., 30., 29., 28., 27., 26., 25., 24., 23., 22., 21., 20.]) - longitude(longitude)float64-50.0 -49.0 -48.0 ... 49.0 50.0
- units :
- degrees_east
- standard_name :
- longitude
- long_name :
- longitude
array([-50., -49., -48., -47., -46., -45., -44., -43., -42., -41., -40., -39., -38., -37., -36., -35., -34., -33., -32., -31., -30., -29., -28., -27., -26., -25., -24., -23., -22., -21., -20., -19., -18., -17., -16., -15., -14., -13., -12., -11., -10., -9., -8., -7., -6., -5., -4., -3., -2., -1., 0., 1., 2., 3., 4., 5., 6., 7., 8., 9., 10., 11., 12., 13., 14., 15., 16., 17., 18., 19., 20., 21., 22., 23., 24., 25., 26., 27., 28., 29., 30., 31., 32., 33., 34., 35., 36., 37., 38., 39., 40., 41., 42., 43., 44., 45., 46., 47., 48., 49., 50.]) - valid_time()datetime64[ns]...
- standard_name :
- time
- long_name :
- time
array('2012-12-13T12:00:00.000000000', dtype='datetime64[ns]')
- t2m(latitude, longitude)float32...
- GRIB_paramId :
- 167
- GRIB_shortName :
- 2t
- GRIB_units :
- K
- GRIB_name :
- 2 metre temperature
- GRIB_cfVarName :
- t2m
- GRIB_dataType :
- an
- GRIB_missingValue :
- 9999
- GRIB_numberOfPoints :
- 3131
- GRIB_totalNumber :
- 0
- GRIB_typeOfLevel :
- surface
- GRIB_NV :
- 0
- GRIB_stepUnits :
- 1
- GRIB_stepType :
- instant
- GRIB_gridType :
- regular_ll
- GRIB_gridDefinitionDescription :
- Latitude/Longitude Grid
- GRIB_Nx :
- 101
- GRIB_iDirectionIncrementInDegrees :
- 1.0
- GRIB_iScansNegatively :
- 0
- GRIB_longitudeOfFirstGridPointInDegrees :
- -50.0
- GRIB_longitudeOfLastGridPointInDegrees :
- 50.0
- GRIB_Ny :
- 31
- GRIB_jDirectionIncrementInDegrees :
- 1.0
- GRIB_jPointsAreConsecutive :
- 0
- GRIB_jScansPositively :
- 0
- GRIB_latitudeOfFirstGridPointInDegrees :
- 50.0
- GRIB_latitudeOfLastGridPointInDegrees :
- 20.0
- long_name :
- 2 metre temperature
- units :
- K
array([[272.88184, 274.03906, 274.66797, ..., 263.7793 , 263.43555, 263.21582], [272.2461 , 273.03223, 274.3037 , ..., 264.86914, 264.1836 , 263.68066], [272.08887, 272.51562, 273.4834 , ..., 265.9297 , 264.97168, 264.36035], ..., [296.4756 , 297.2666 , 296.20117, ..., 295.20898, 295.27637, 295.8584 ], [295.44434, 295.84766, 296.86328, ..., 296.99023, 296.7754 , 296.95215], [295.3623 , 296.4131 , 296.9795 , ..., 297.48145, 297.81934, 298.37598]], dtype=float32) - msl(latitude, longitude)float32...
- GRIB_paramId :
- 151
- GRIB_shortName :
- msl
- GRIB_units :
- Pa
- GRIB_name :
- Mean sea level pressure
- GRIB_cfName :
- air_pressure_at_mean_sea_level
- GRIB_cfVarName :
- msl
- GRIB_dataType :
- an
- GRIB_missingValue :
- 9999
- GRIB_numberOfPoints :
- 3131
- GRIB_totalNumber :
- 0
- GRIB_typeOfLevel :
- surface
- GRIB_NV :
- 0
- GRIB_stepUnits :
- 1
- GRIB_stepType :
- instant
- GRIB_gridType :
- regular_ll
- GRIB_gridDefinitionDescription :
- Latitude/Longitude Grid
- GRIB_Nx :
- 101
- GRIB_iDirectionIncrementInDegrees :
- 1.0
- GRIB_iScansNegatively :
- 0
- GRIB_longitudeOfFirstGridPointInDegrees :
- -50.0
- GRIB_longitudeOfLastGridPointInDegrees :
- 50.0
- GRIB_Ny :
- 31
- GRIB_jDirectionIncrementInDegrees :
- 1.0
- GRIB_jPointsAreConsecutive :
- 0
- GRIB_jScansPositively :
- 0
- GRIB_latitudeOfFirstGridPointInDegrees :
- 50.0
- GRIB_latitudeOfLastGridPointInDegrees :
- 20.0
- long_name :
- Mean sea level pressure
- units :
- Pa
- standard_name :
- air_pressure_at_mean_sea_level
array([[100246.31,  99966.94,  99689.56, ..., 104225.56, 104340.56, 104438.69],
       [100550.31, 100306.06, 100036.19, ..., 103992.19, 104111.81, 104229.81],
       [100829.19, 100630.31, 100389.94, ..., 103752.44, 103878.69, 104008.19],
       ...,
       [101611.94, 101559.19, 101598.31, ..., 101503.06, 101514.56, 101499.69],
       [101519.44, 101473.44, 101491.94, ..., 101462.19, 101485.19, 101482.69],
       [101446.44, 101380.56, 101366.31, ..., 101425.19, 101417.19, 101398.81]],
      dtype=float32)
- GRIB_edition :
- 1
- GRIB_centre :
- ecmf
- GRIB_centreDescription :
- European Centre for Medium-Range Weather Forecasts
- GRIB_subCentre :
- 0
- Conventions :
- CF-1.7
- institution :
- European Centre for Medium-Range Weather Forecasts
- history :
- 2021-03-24T13:23:13 GRIB to CDM+CF via cfgrib-0.9.8.5/ecCodes-2.20.0 with {"source": "/var/folders/gt/_nyhyz497ns5szsvxw16gz6m0000gn/T/climetlab-baudouin/marsretriever-7873554f9da36323860e14fb1af991c80b8d61f663faf30053e8673a1abb63a9.cache", "filter_by_keys": {}, "encode_cf": ["parameter", "time", "geography", "vertical"]}