You can run this notebook in ![]() , in
, in ![]() , in
, in ![]() or in
or in  .
.
[1]:
!pip install --quiet climetlab matplotlib
WeatherBench
This is an attempt to reproduce this research: https://arxiv.org/abs/2002.00469. There is a notebook available at: https://binder.pangeo.io/v2/gh/pangeo-data/WeatherBench/master?filepath=quickstart.ipynb
[2]:
import matplotlib.pyplot as plt
[3]:
import climetlab as cml
[ ]:
ds = cml.load_dataset("weather-bench")
[5]:
ds
[5]:
weather-bench
| Home page | https://raspstephan.github.io/blog/weatherbench/ |
| Documentation | - |
| Citation | @article{rasp2020weatherbench,
title={WeatherBench: A benchmark dataset for data-driven weather forecasting},
author={Rasp, Stephan and Dueben, Peter D and Scher, Sebastian and Weyn,
Jonathan A and Mouatadid, Soukayna and Thuerey, Nils},
journal={arXiv preprint arXiv:2002.00469},
year={2020}
}
|
| Licence | - |
[6]:
print(ds.citation)
@article{rasp2020weatherbench,
  title={WeatherBench: A benchmark dataset for data-driven weather forecasting},
  author={Rasp, Stephan and Dueben, Peter D and Scher, Sebastian and Weyn,
  Jonathan A and Mouatadid, Soukayna and Thuerey, Nils},
  journal={arXiv preprint arXiv:2002.00469},
  year={2020}
}
[7]:
z500 = ds.to_xarray()
[8]:
z500
[8]:
<xarray.Dataset>
Dimensions:  (lat: 32, lon: 64, time: 350640)
Coordinates:
    level    int32 500
  * lon      (lon) float64 0.0 5.625 11.25 16.88 ... 337.5 343.1 348.8 354.4
  * lat      (lat) float64 -87.19 -81.56 -75.94 -70.31 ... 75.94 81.56 87.19
  * time     (time) datetime64[ns] 1979-01-01 ... 2018-12-31T23:00:00
Data variables:
    z        (time, lat, lon) float32 dask.array<chunksize=(8760, 32, 64), meta=np.ndarray>
Attributes:
    Conventions:  CF-1.6
    history:      2019-11-10 20:33:23 GMT by grib_to_netcdf-2.14.0: /opt/ecmw...
xarray.Dataset
- lat: 32
- lon: 64
- time: 350640
- level()int32500
- units :
- millibars
- long_name :
- pressure_level
array(500, dtype=int32)
- lon(lon)float640.0 5.625 11.25 ... 348.8 354.4
array([ 0. , 5.625, 11.25 , 16.875, 22.5 , 28.125, 33.75 , 39.375, 45. , 50.625, 56.25 , 61.875, 67.5 , 73.125, 78.75 , 84.375, 90. , 95.625, 101.25 , 106.875, 112.5 , 118.125, 123.75 , 129.375, 135. , 140.625, 146.25 , 151.875, 157.5 , 163.125, 168.75 , 174.375, 180. , 185.625, 191.25 , 196.875, 202.5 , 208.125, 213.75 , 219.375, 225. , 230.625, 236.25 , 241.875, 247.5 , 253.125, 258.75 , 264.375, 270. , 275.625, 281.25 , 286.875, 292.5 , 298.125, 303.75 , 309.375, 315. , 320.625, 326.25 , 331.875, 337.5 , 343.125, 348.75 , 354.375]) - lat(lat)float64-87.19 -81.56 ... 81.56 87.19
array([-87.1875, -81.5625, -75.9375, -70.3125, -64.6875, -59.0625, -53.4375, -47.8125, -42.1875, -36.5625, -30.9375, -25.3125, -19.6875, -14.0625, -8.4375, -2.8125, 2.8125, 8.4375, 14.0625, 19.6875, 25.3125, 30.9375, 36.5625, 42.1875, 47.8125, 53.4375, 59.0625, 64.6875, 70.3125, 75.9375, 81.5625, 87.1875]) - time(time)datetime64[ns]1979-01-01 ... 2018-12-31T23:00:00
- long_name :
- time
array(['1979-01-01T00:00:00.000000000', '1979-01-01T01:00:00.000000000',
       '1979-01-01T02:00:00.000000000', ..., '2018-12-31T21:00:00.000000000',
       '2018-12-31T22:00:00.000000000', '2018-12-31T23:00:00.000000000'],
      dtype='datetime64[ns]')
- z(time, lat, lon)float32dask.array<chunksize=(8760, 32, 64), meta=np.ndarray>
- units :
- m**2 s**-2
- long_name :
- Geopotential
- standard_name :
- geopotential
Array Chunk Bytes 2.87 GB 71.96 MB Shape (350640, 32, 64) (8784, 32, 64) Count 120 Tasks 40 Chunks Type float32 numpy.ndarray
- Conventions :
- CF-1.6
- history :
- 2019-11-10 20:33:23 GMT by grib_to_netcdf-2.14.0: /opt/ecmwf/eccodes/bin/grib_to_netcdf -o /cache/data5/adaptor.mars.internal-1573408778.8616278-11514-5-32bb1559-bce6-4a86-9ae4-60f0d33d9246.nc /cache/tmp/32bb1559-bce6-4a86-9ae4-60f0d33d9246-adaptor.mars.internal-1573408778.8624167-11514-2-tmp.grib
[9]:
cml.plot_map(z500)

[10]:
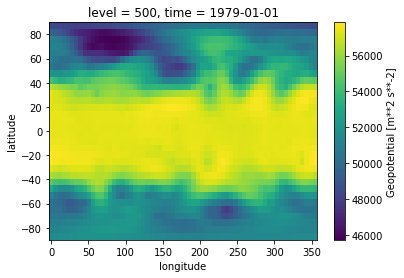
z500.z.isel(time=0).plot()
[10]:
<matplotlib.collections.QuadMesh at 0x7f62146b2cd0>
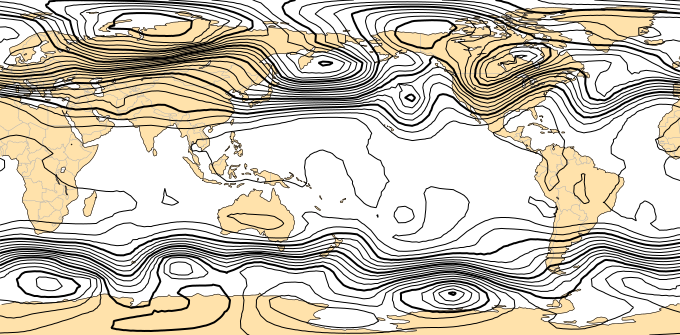
[11]:
cml.plot_map(z500.z.isel(time=0))
[12]:
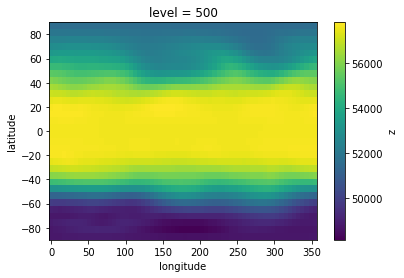
climatology = z500.sel(time=slice("2016", "2016")).mean("time").load()
[13]:
climatology.z.plot()
[13]:
<matplotlib.collections.QuadMesh at 0x7f62145059a0>
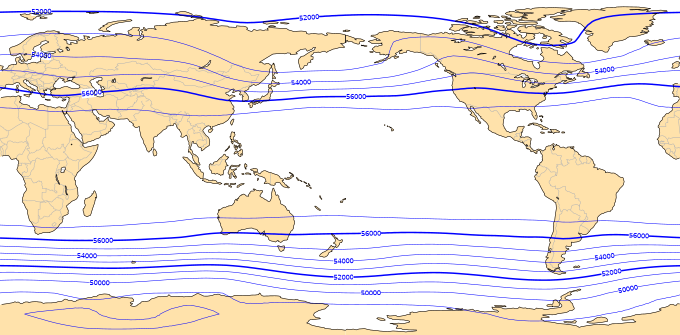
[14]:
cml.plot_map(climatology.z)
[15]:
climatology.z
[15]:
<xarray.DataArray 'z' (lat: 32, lon: 64)>
array([[48765.18 , 48774.066, 48782.83 , ..., 48745.145, 48750.582,
        48757.645],
       [48755.164, 48798.348, 48845.02 , ..., 48690.23 , 48700.72 ,
        48721.727],
       [48890.742, 48941.703, 48997.42 , ..., 48815.234, 48822.87 ,
        48850.105],
       ...,
       [52378.613, 52398.484, 52420.074, ..., 52361.254, 52363.426,
        52366.344],
       [51937.207, 51943.78 , 51950.414, ..., 51906.508, 51919.223,
        51928.72 ],
       [51565.38 , 51571.426, 51578.15 , ..., 51543.97 , 51551.11 ,
        51558.305]], dtype=float32)
Coordinates:
    level    int32 500
  * lon      (lon) float64 0.0 5.625 11.25 16.88 ... 337.5 343.1 348.8 354.4
  * lat      (lat) float64 -87.19 -81.56 -75.94 -70.31 ... 75.94 81.56 87.19
xarray.DataArray
'z'
- lat: 32
- lon: 64
- 4.877e+04 4.877e+04 4.878e+04 ... 5.154e+04 5.155e+04 5.156e+04
array([[48765.18 , 48774.066, 48782.83 , ..., 48745.145, 48750.582, 48757.645], [48755.164, 48798.348, 48845.02 , ..., 48690.23 , 48700.72 , 48721.727], [48890.742, 48941.703, 48997.42 , ..., 48815.234, 48822.87 , 48850.105], ..., [52378.613, 52398.484, 52420.074, ..., 52361.254, 52363.426, 52366.344], [51937.207, 51943.78 , 51950.414, ..., 51906.508, 51919.223, 51928.72 ], [51565.38 , 51571.426, 51578.15 , ..., 51543.97 , 51551.11 , 51558.305]], dtype=float32) - level()int32500
- units :
- millibars
- long_name :
- pressure_level
array(500, dtype=int32)
- lon(lon)float640.0 5.625 11.25 ... 348.8 354.4
- standard_name :
- longitude
array([ 0. , 5.625, 11.25 , 16.875, 22.5 , 28.125, 33.75 , 39.375, 45. , 50.625, 56.25 , 61.875, 67.5 , 73.125, 78.75 , 84.375, 90. , 95.625, 101.25 , 106.875, 112.5 , 118.125, 123.75 , 129.375, 135. , 140.625, 146.25 , 151.875, 157.5 , 163.125, 168.75 , 174.375, 180. , 185.625, 191.25 , 196.875, 202.5 , 208.125, 213.75 , 219.375, 225. , 230.625, 236.25 , 241.875, 247.5 , 253.125, 258.75 , 264.375, 270. , 275.625, 281.25 , 286.875, 292.5 , 298.125, 303.75 , 309.375, 315. , 320.625, 326.25 , 331.875, 337.5 , 343.125, 348.75 , 354.375]) - lat(lat)float64-87.19 -81.56 ... 81.56 87.19
- standard_name :
- latitude
array([-87.1875, -81.5625, -75.9375, -70.3125, -64.6875, -59.0625, -53.4375,
       -47.8125, -42.1875, -36.5625, -30.9375, -25.3125, -19.6875, -14.0625,
        -8.4375,  -2.8125,   2.8125,   8.4375,  14.0625,  19.6875,  25.3125,
        30.9375,  36.5625,  42.1875,  47.8125,  53.4375,  59.0625,  64.6875,
        70.3125,  75.9375,  81.5625,  87.1875])