You can run this notebook in ![]() , in
, in ![]() , in
, in ![]() or in
or in  .
.
[55]:
!pip install --quiet climetlab matplotlib
DEPRECATION: Configuring installation scheme with distutils config files is deprecated and will no longer work in the near future. If you are using a Homebrew or Linuxbrew Python, please see discussion at https://github.com/Homebrew/homebrew-core/issues/76621
DEPRECATION: Configuring installation scheme with distutils config files is deprecated and will no longer work in the near future. If you are using a Homebrew or Linuxbrew Python, please see discussion at https://github.com/Homebrew/homebrew-core/issues/76621
NOAA’s hurricane database
[56]:
import climetlab as cml
[57]:
atlantic = cml.load_dataset("hurricane-database", bassin="atlantic")
Get the Pandas frame
[58]:
df = atlantic.to_pandas()
[59]:
df.bassin.unique()
[59]:
array(['AL'], dtype=object)
Huricanes making landfall at category 5
[60]:
df[(df.category == 5) & (df.type == "L")]
[60]:
| bassin | number | year | name | time | type | status | lat | lon | knots | category | pressure | |
|---|---|---|---|---|---|---|---|---|---|---|---|---|
| 17942 | AL | 3 | 1935 | unnamed | 1935-09-03 02:00:00 | L | HU | 24.8 | -80.8 | 160.0 | 5 | 892.0 |
| 24300 | AL | 10 | 1955 | janet | 1955-09-27 17:00:00 | L | HU | 17.4 | -83.9 | 140.0 | 5 | NaN |
| 24303 | AL | 10 | 1955 | janet | 1955-09-28 05:00:00 | L | HU | 18.4 | -87.8 | 150.0 | 5 | 914.0 |
| 28888 | AL | 9 | 1969 | camille | 1969-08-18 04:00:00 | L | HU | 30.3 | -89.4 | 150.0 | 5 | 900.0 |
| 36448 | AL | 8 | 1988 | gilbert | 1988-09-14 15:00:00 | L | HU | 20.7 | -87.0 | 140.0 | 5 | 900.0 |
| 37967 | AL | 4 | 1992 | andrew | 1992-08-23 21:00:00 | L | HU | 25.4 | -76.6 | 140.0 | 5 | 923.0 |
| 37971 | AL | 4 | 1992 | andrew | 1992-08-24 08:40:00 | L | HU | 25.5 | -80.2 | 145.0 | 5 | 926.0 |
| 37972 | AL | 4 | 1992 | andrew | 1992-08-24 09:05:00 | L | HU | 25.5 | -80.3 | 145.0 | 5 | 922.0 |
| 45134 | AL | 4 | 2007 | dean | 2007-08-21 08:30:00 | L | HU | 18.7 | -87.7 | 150.0 | 5 | 905.0 |
| 45182 | AL | 6 | 2007 | felix | 2007-09-04 12:00:00 | L | HU | 14.3 | -83.2 | 140.0 | 5 | 934.0 |
| 49925 | AL | 11 | 2017 | irma | 2017-09-06 05:45:00 | L | HU | 17.7 | -61.8 | 155.0 | 5 | 914.0 |
| 49927 | AL | 11 | 2017 | irma | 2017-09-06 11:15:00 | L | HU | 18.1 | -63.1 | 155.0 | 5 | 914.0 |
| 49929 | AL | 11 | 2017 | irma | 2017-09-06 16:30:00 | L | HU | 18.5 | -64.4 | 155.0 | 5 | 915.0 |
| 49941 | AL | 11 | 2017 | irma | 2017-09-09 03:00:00 | L | HU | 22.3 | -77.9 | 145.0 | 5 | 924.0 |
| 50139 | AL | 15 | 2017 | maria | 2017-09-19 01:15:00 | L | HU | 15.4 | -61.3 | 145.0 | 5 | 922.0 |
| 50835 | AL | 14 | 2018 | michael | 2018-10-10 17:30:00 | L | HU | 30.0 | -85.5 | 140.0 | 5 | 919.0 |
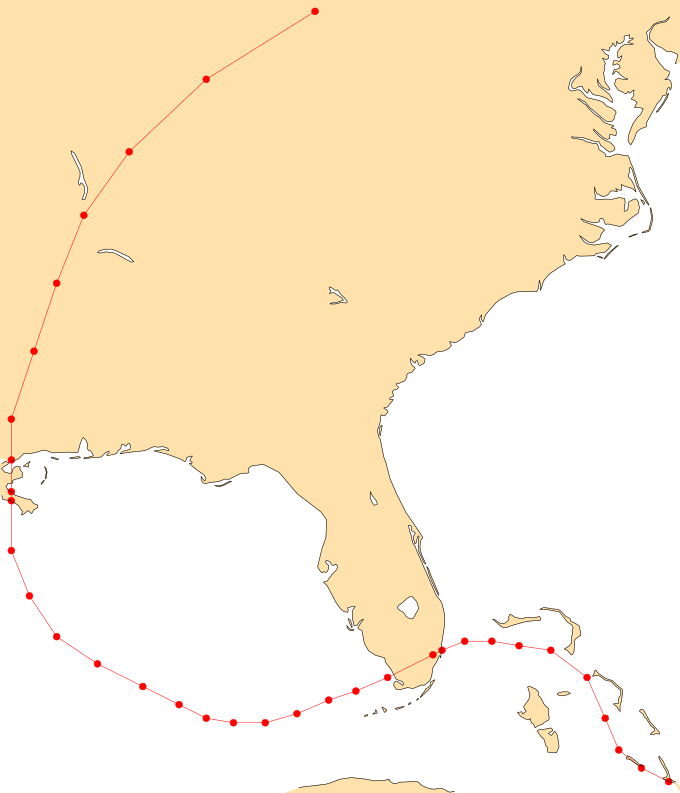
Get the track for Katrina
[61]:
katrina = df[(df.name == "katrina") & (df.year == 2005)]
[62]:
katrina
[62]:
| bassin | number | year | name | time | type | status | lat | lon | knots | category | pressure | |
|---|---|---|---|---|---|---|---|---|---|---|---|---|
| 44065 | AL | 12 | 2005 | katrina | 2005-08-23 18:00:00 | TD | 23.1 | -75.1 | 30.0 | 1 | 1008.0 | |
| 44066 | AL | 12 | 2005 | katrina | 2005-08-24 00:00:00 | TD | 23.4 | -75.7 | 30.0 | 1 | 1007.0 | |
| 44067 | AL | 12 | 2005 | katrina | 2005-08-24 06:00:00 | TD | 23.8 | -76.2 | 30.0 | 1 | 1007.0 | |
| 44068 | AL | 12 | 2005 | katrina | 2005-08-24 12:00:00 | TS | 24.5 | -76.5 | 35.0 | 1 | 1006.0 | |
| 44069 | AL | 12 | 2005 | katrina | 2005-08-24 18:00:00 | TS | 25.4 | -76.9 | 40.0 | 1 | 1003.0 | |
| 44070 | AL | 12 | 2005 | katrina | 2005-08-25 00:00:00 | TS | 26.0 | -77.7 | 45.0 | 1 | 1000.0 | |
| 44071 | AL | 12 | 2005 | katrina | 2005-08-25 06:00:00 | TS | 26.1 | -78.4 | 50.0 | 1 | 997.0 | |
| 44072 | AL | 12 | 2005 | katrina | 2005-08-25 12:00:00 | TS | 26.2 | -79.0 | 55.0 | 1 | 994.0 | |
| 44073 | AL | 12 | 2005 | katrina | 2005-08-25 18:00:00 | TS | 26.2 | -79.6 | 60.0 | 1 | 988.0 | |
| 44074 | AL | 12 | 2005 | katrina | 2005-08-25 22:30:00 | L | HU | 26.0 | -80.1 | 70.0 | 1 | 984.0 |
| 44075 | AL | 12 | 2005 | katrina | 2005-08-26 00:00:00 | HU | 25.9 | -80.3 | 70.0 | 1 | 983.0 | |
| 44076 | AL | 12 | 2005 | katrina | 2005-08-26 06:00:00 | HU | 25.4 | -81.3 | 65.0 | 1 | 987.0 | |
| 44077 | AL | 12 | 2005 | katrina | 2005-08-26 12:00:00 | HU | 25.1 | -82.0 | 75.0 | 1 | 979.0 | |
| 44078 | AL | 12 | 2005 | katrina | 2005-08-26 18:00:00 | HU | 24.9 | -82.6 | 85.0 | 2 | 968.0 | |
| 44079 | AL | 12 | 2005 | katrina | 2005-08-27 00:00:00 | HU | 24.6 | -83.3 | 90.0 | 2 | 959.0 | |
| 44080 | AL | 12 | 2005 | katrina | 2005-08-27 06:00:00 | HU | 24.4 | -84.0 | 95.0 | 2 | 950.0 | |
| 44081 | AL | 12 | 2005 | katrina | 2005-08-27 12:00:00 | HU | 24.4 | -84.7 | 100.0 | 3 | 942.0 | |
| 44082 | AL | 12 | 2005 | katrina | 2005-08-27 18:00:00 | HU | 24.5 | -85.3 | 100.0 | 3 | 948.0 | |
| 44083 | AL | 12 | 2005 | katrina | 2005-08-28 00:00:00 | HU | 24.8 | -85.9 | 100.0 | 3 | 941.0 | |
| 44084 | AL | 12 | 2005 | katrina | 2005-08-28 06:00:00 | HU | 25.2 | -86.7 | 125.0 | 4 | 930.0 | |
| 44085 | AL | 12 | 2005 | katrina | 2005-08-28 12:00:00 | HU | 25.7 | -87.7 | 145.0 | 5 | 909.0 | |
| 44086 | AL | 12 | 2005 | katrina | 2005-08-28 18:00:00 | HU | 26.3 | -88.6 | 150.0 | 5 | 902.0 | |
| 44087 | AL | 12 | 2005 | katrina | 2005-08-29 00:00:00 | HU | 27.2 | -89.2 | 140.0 | 5 | 905.0 | |
| 44088 | AL | 12 | 2005 | katrina | 2005-08-29 06:00:00 | HU | 28.2 | -89.6 | 125.0 | 4 | 913.0 | |
| 44089 | AL | 12 | 2005 | katrina | 2005-08-29 11:10:00 | L | HU | 29.3 | -89.6 | 110.0 | 3 | 920.0 |
| 44090 | AL | 12 | 2005 | katrina | 2005-08-29 12:00:00 | HU | 29.5 | -89.6 | 110.0 | 3 | 923.0 | |
| 44091 | AL | 12 | 2005 | katrina | 2005-08-29 14:45:00 | L | HU | 30.2 | -89.6 | 105.0 | 3 | 928.0 |
| 44092 | AL | 12 | 2005 | katrina | 2005-08-29 18:00:00 | HU | 31.1 | -89.6 | 80.0 | 1 | 948.0 | |
| 44093 | AL | 12 | 2005 | katrina | 2005-08-30 00:00:00 | TS | 32.6 | -89.1 | 50.0 | 1 | 961.0 | |
| 44094 | AL | 12 | 2005 | katrina | 2005-08-30 06:00:00 | TS | 34.1 | -88.6 | 40.0 | 1 | 978.0 | |
| 44095 | AL | 12 | 2005 | katrina | 2005-08-30 12:00:00 | TD | 35.6 | -88.0 | 30.0 | 1 | 985.0 | |
| 44096 | AL | 12 | 2005 | katrina | 2005-08-30 18:00:00 | TD | 37.0 | -87.0 | 30.0 | 1 | 990.0 | |
| 44097 | AL | 12 | 2005 | katrina | 2005-08-31 00:00:00 | EX | 38.6 | -85.3 | 30.0 | 1 | 994.0 | |
| 44098 | AL | 12 | 2005 | katrina | 2005-08-31 06:00:00 | EX | 40.1 | -82.9 | 25.0 | 1 | 996.0 |
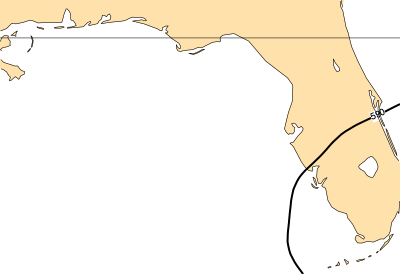
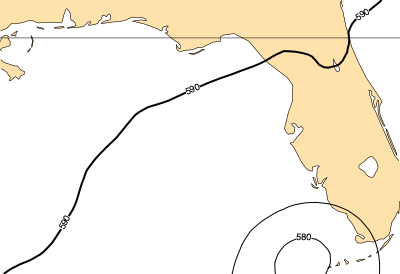
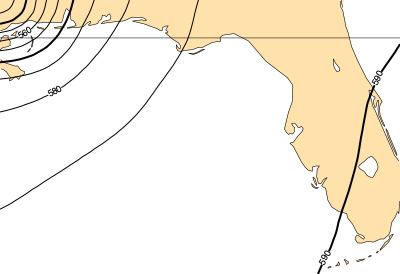
Plot the track
[63]:
cml.plot_map(katrina, margins=0.25)
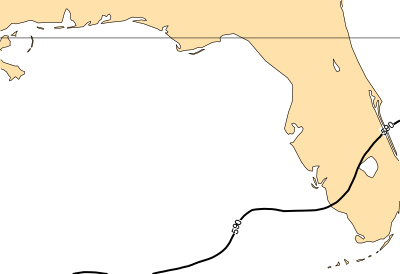
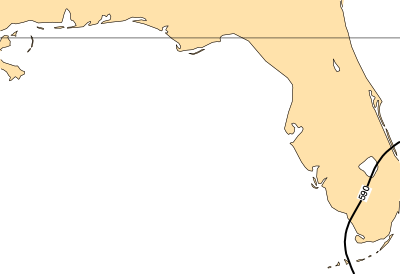
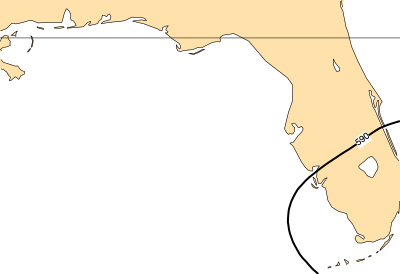
Retrieve matching fields from ERA5
[64]:
hurricane = katrina[katrina.status == "HU"]
hurricane
[64]:
| bassin | number | year | name | time | type | status | lat | lon | knots | category | pressure | |
|---|---|---|---|---|---|---|---|---|---|---|---|---|
| 44074 | AL | 12 | 2005 | katrina | 2005-08-25 22:30:00 | L | HU | 26.0 | -80.1 | 70.0 | 1 | 984.0 |
| 44075 | AL | 12 | 2005 | katrina | 2005-08-26 00:00:00 | HU | 25.9 | -80.3 | 70.0 | 1 | 983.0 | |
| 44076 | AL | 12 | 2005 | katrina | 2005-08-26 06:00:00 | HU | 25.4 | -81.3 | 65.0 | 1 | 987.0 | |
| 44077 | AL | 12 | 2005 | katrina | 2005-08-26 12:00:00 | HU | 25.1 | -82.0 | 75.0 | 1 | 979.0 | |
| 44078 | AL | 12 | 2005 | katrina | 2005-08-26 18:00:00 | HU | 24.9 | -82.6 | 85.0 | 2 | 968.0 | |
| 44079 | AL | 12 | 2005 | katrina | 2005-08-27 00:00:00 | HU | 24.6 | -83.3 | 90.0 | 2 | 959.0 | |
| 44080 | AL | 12 | 2005 | katrina | 2005-08-27 06:00:00 | HU | 24.4 | -84.0 | 95.0 | 2 | 950.0 | |
| 44081 | AL | 12 | 2005 | katrina | 2005-08-27 12:00:00 | HU | 24.4 | -84.7 | 100.0 | 3 | 942.0 | |
| 44082 | AL | 12 | 2005 | katrina | 2005-08-27 18:00:00 | HU | 24.5 | -85.3 | 100.0 | 3 | 948.0 | |
| 44083 | AL | 12 | 2005 | katrina | 2005-08-28 00:00:00 | HU | 24.8 | -85.9 | 100.0 | 3 | 941.0 | |
| 44084 | AL | 12 | 2005 | katrina | 2005-08-28 06:00:00 | HU | 25.2 | -86.7 | 125.0 | 4 | 930.0 | |
| 44085 | AL | 12 | 2005 | katrina | 2005-08-28 12:00:00 | HU | 25.7 | -87.7 | 145.0 | 5 | 909.0 | |
| 44086 | AL | 12 | 2005 | katrina | 2005-08-28 18:00:00 | HU | 26.3 | -88.6 | 150.0 | 5 | 902.0 | |
| 44087 | AL | 12 | 2005 | katrina | 2005-08-29 00:00:00 | HU | 27.2 | -89.2 | 140.0 | 5 | 905.0 | |
| 44088 | AL | 12 | 2005 | katrina | 2005-08-29 06:00:00 | HU | 28.2 | -89.6 | 125.0 | 4 | 913.0 | |
| 44089 | AL | 12 | 2005 | katrina | 2005-08-29 11:10:00 | L | HU | 29.3 | -89.6 | 110.0 | 3 | 920.0 |
| 44090 | AL | 12 | 2005 | katrina | 2005-08-29 12:00:00 | HU | 29.5 | -89.6 | 110.0 | 3 | 923.0 | |
| 44091 | AL | 12 | 2005 | katrina | 2005-08-29 14:45:00 | L | HU | 30.2 | -89.6 | 105.0 | 3 | 928.0 |
| 44092 | AL | 12 | 2005 | katrina | 2005-08-29 18:00:00 | HU | 31.1 | -89.6 | 80.0 | 1 | 948.0 |
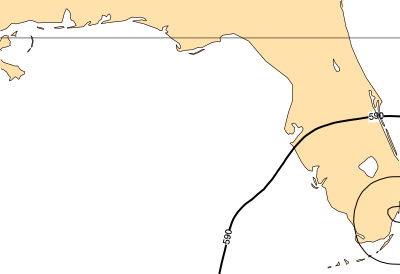
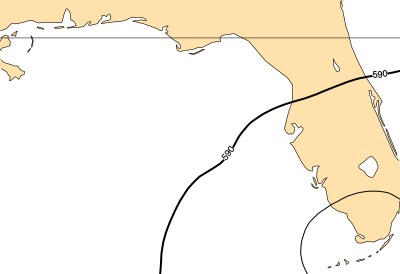
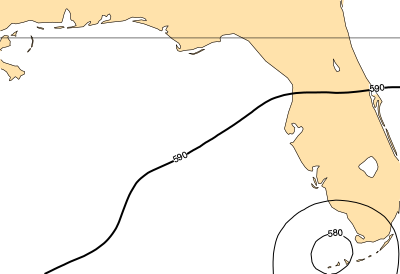
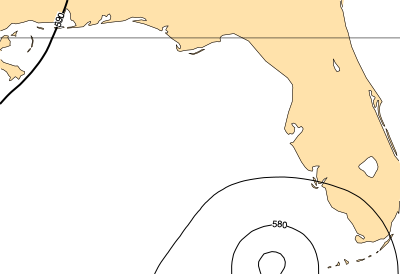
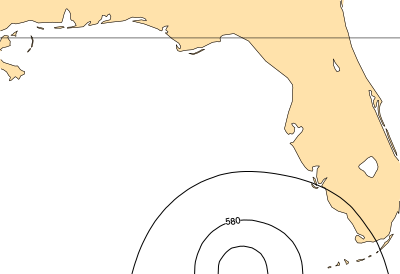
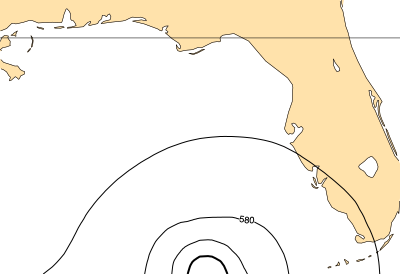
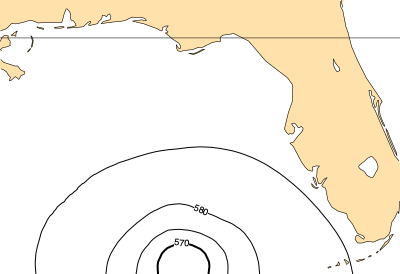
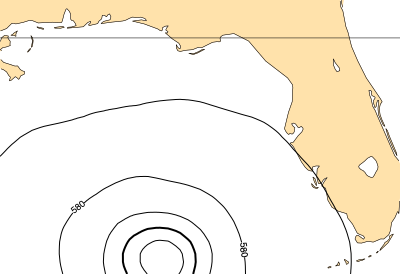
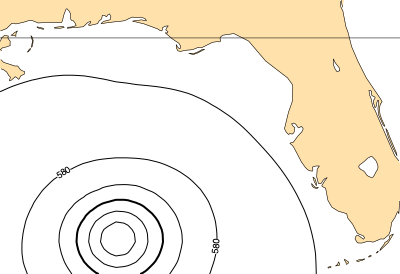
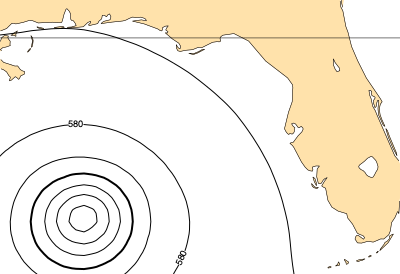
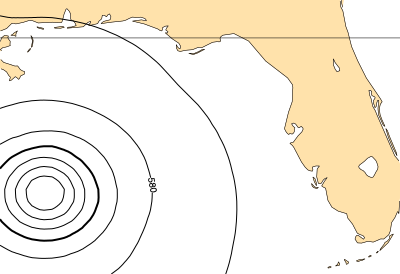
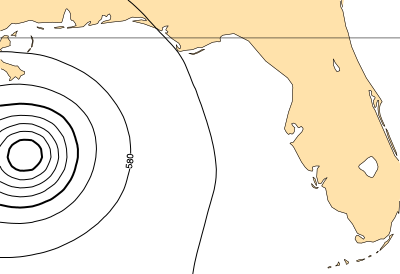
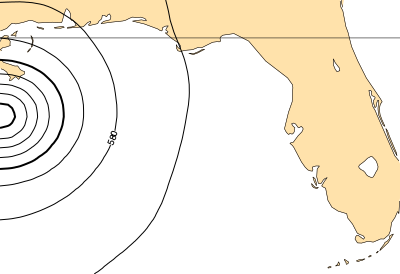
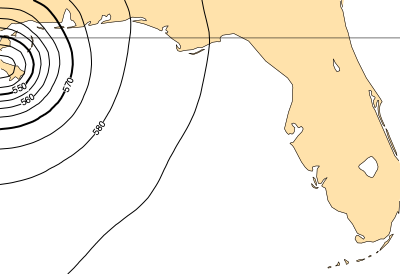
We can use the Pandas frame to specify the date and area of the request to the CDS.
[65]:
source = cml.load_source(
    "cds",
    "reanalysis-era5-pressure-levels",
    variable="z",
    level=500,
    product_type="reanalysis",
    time=[0, 6, 12, 18],
    date=hurricane,
    area=hurricane,
)

for s in source:
    cml.plot_map(s, width=400, grid=True)
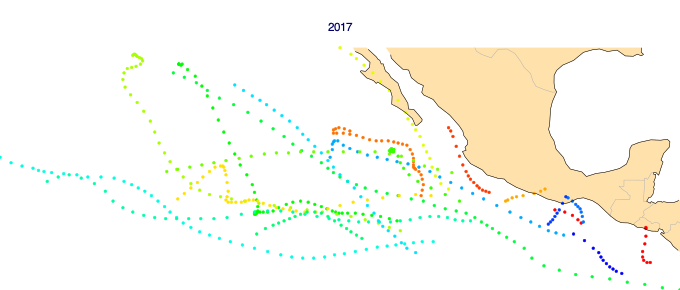
Pacific bassin
[66]:
pacific = cml.load_dataset("hurricane-database", bassin="pacific")
Get the Pandas frame
[67]:
df = pacific.to_pandas()
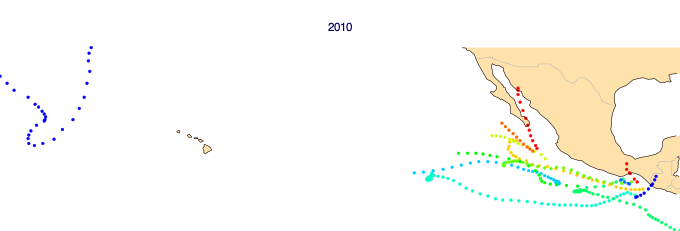
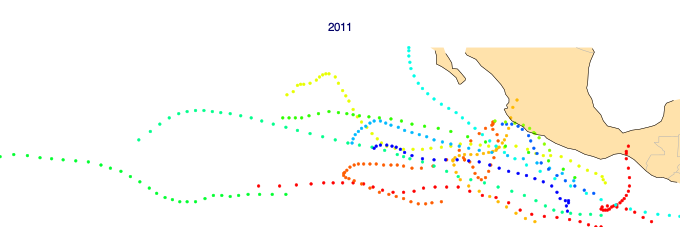
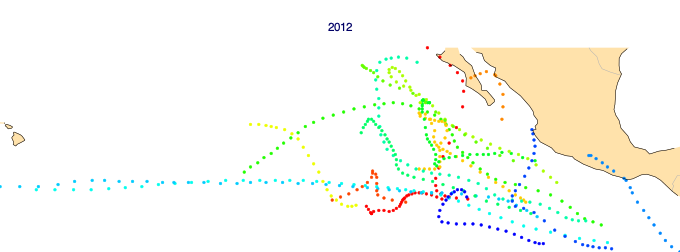
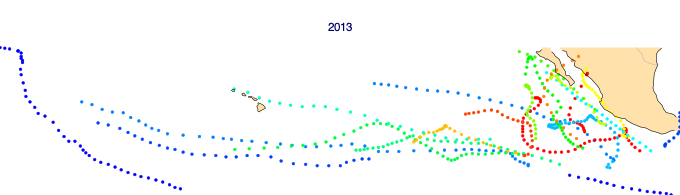
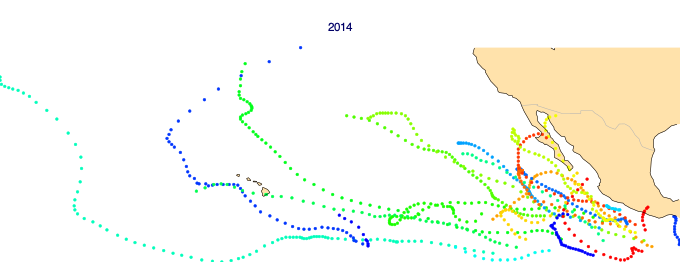
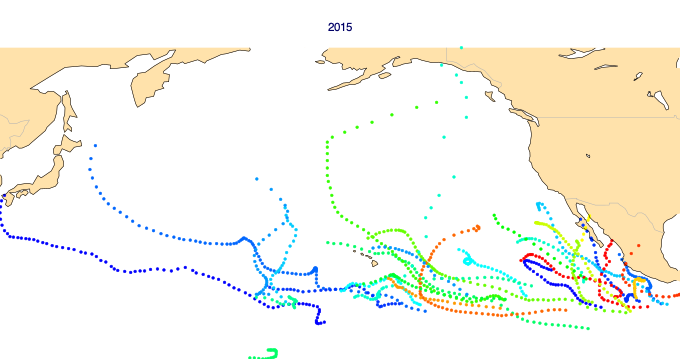
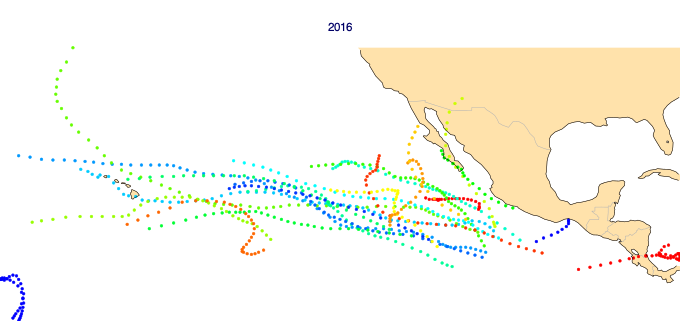
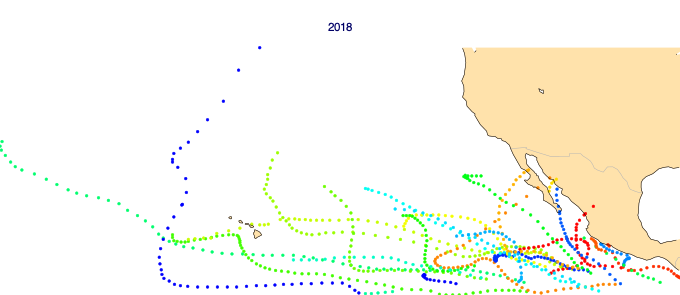
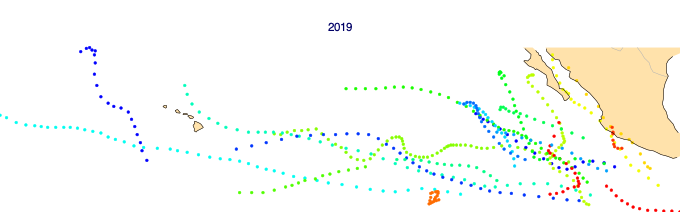
Plot a few years
[68]:
for year in range(2010, 2020):
    cml.plot_map(
        df[df.year == year], column="number", title=year, style="rainbow-markers"
    )
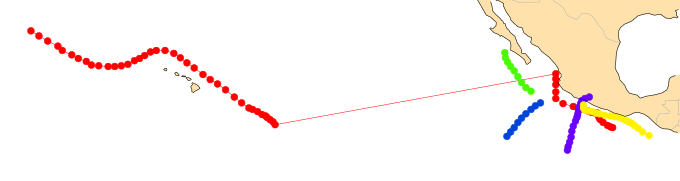
Plot each track independently
[69]:
import matplotlib.pyplot as plt
[70]:
cmap = plt.get_cmap("prism")
[71]:
p = cml.new_plot(margins="5%")
i = 0
for year in range(1950, 1955):
    cp = df[(df.year == year) & (df.number == 1)]
    if len(cp):
        p.plot_map(cp, style={"+symbol_colour": cmap((i * 20) % cmap.N)})
        i += 1
p.show()
[ ]: