You can run this notebook in ![]() , in
, in ![]() , in
, in ![]() or in
or in  .
.
[1]:
!pip install --quiet climetlab
[2]:
%config Application.log_level="INFO"
More plotting examples
[3]:
import climetlab as cml
Get some GRIB data
[4]:
ds = cml.load_dataset("sample-grib-data")
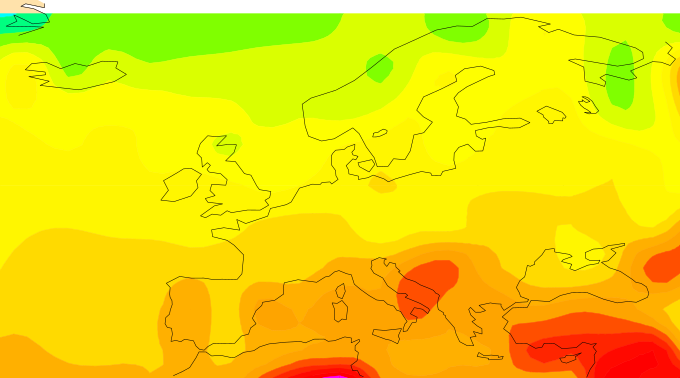
Plot the first field
[5]:
cml.plot_map(ds[0])
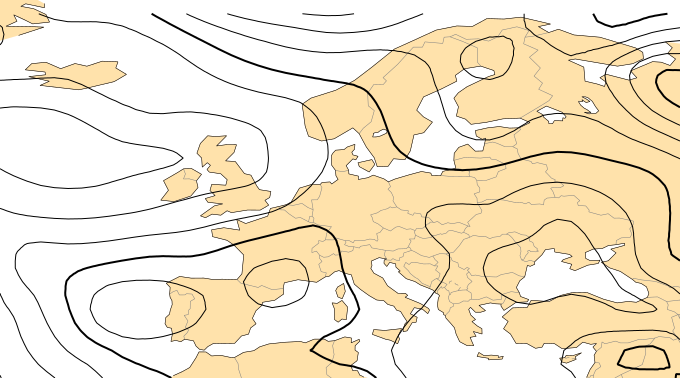
Plot the second field
[6]:
cml.plot_map(ds[1])
Plot both fields on the same map
[7]:
cml.plot_map((ds[0], ds[1]))
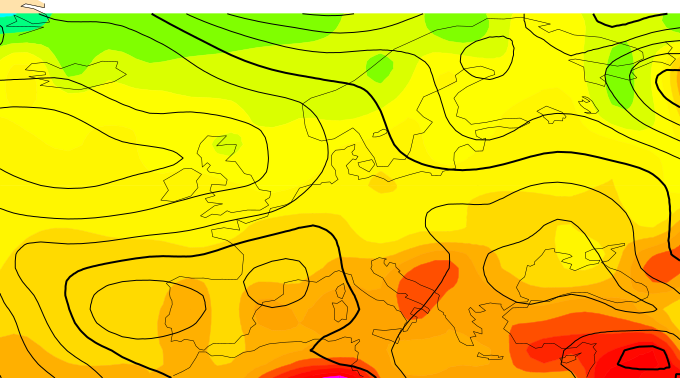
Alternative method:
[8]:
p = cml.new_plot()
p.plot_map(ds[0])
p.plot_map(ds[1])
p.show()

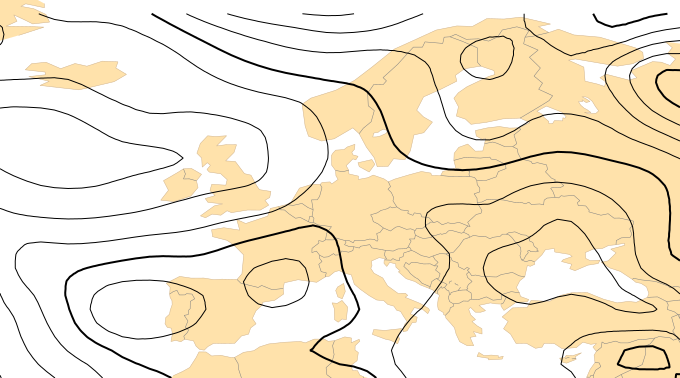
Switch off background map
[9]:
cml.plot_map(ds[1], background=False)

Switch off both foreground and background
[10]:
cml.plot_map(
    ds[1],
    foreground=False,
)
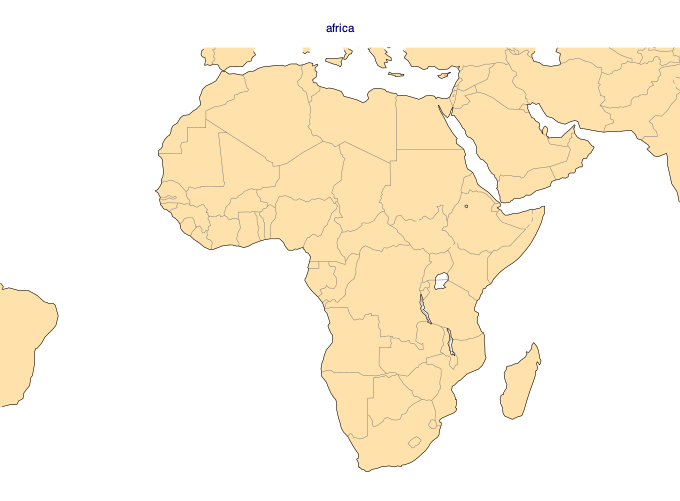
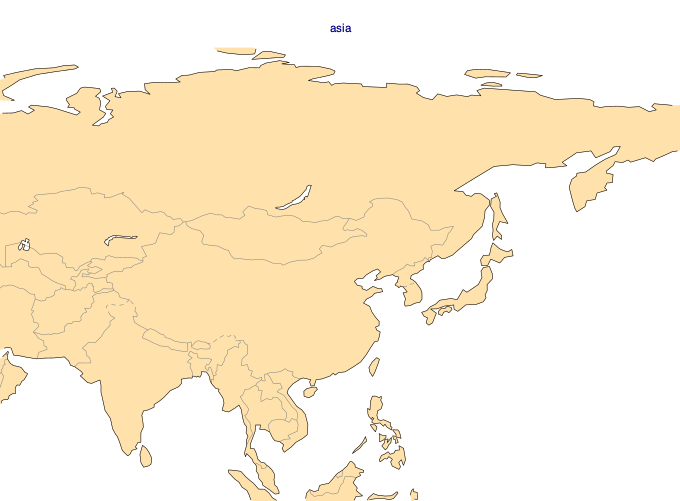
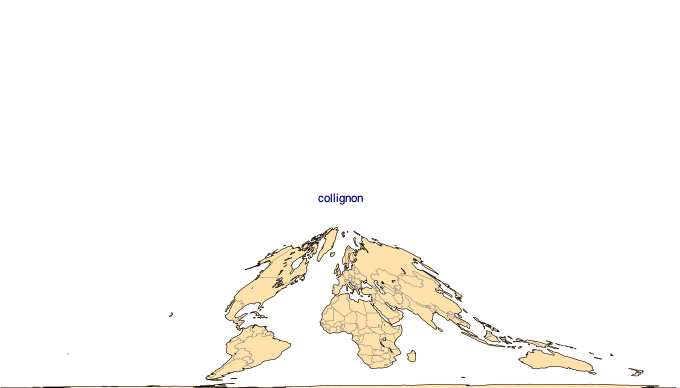
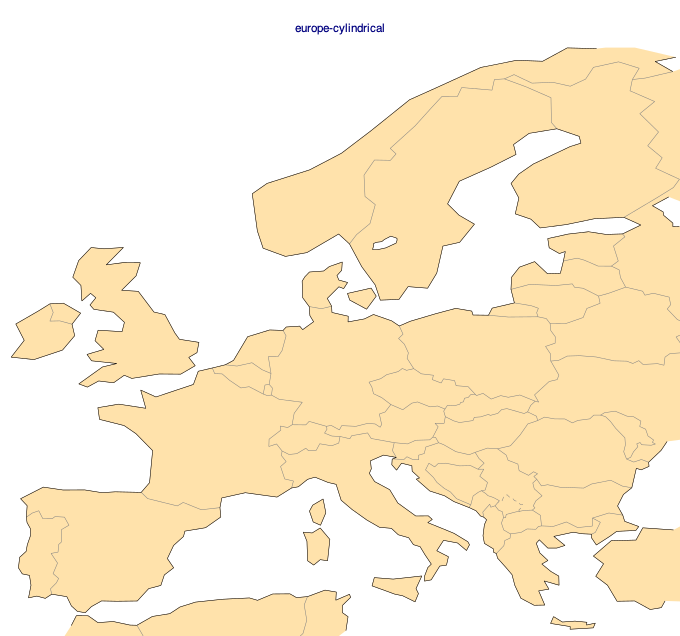
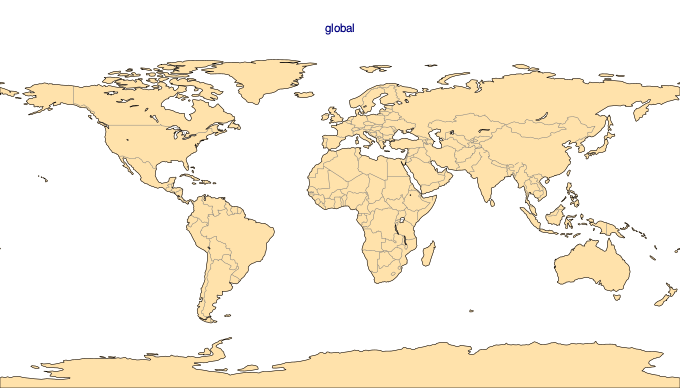
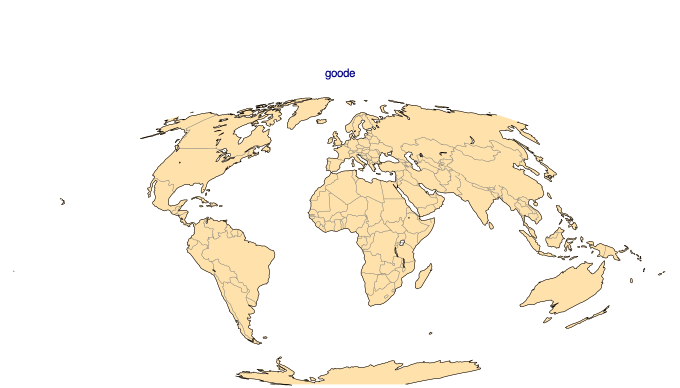
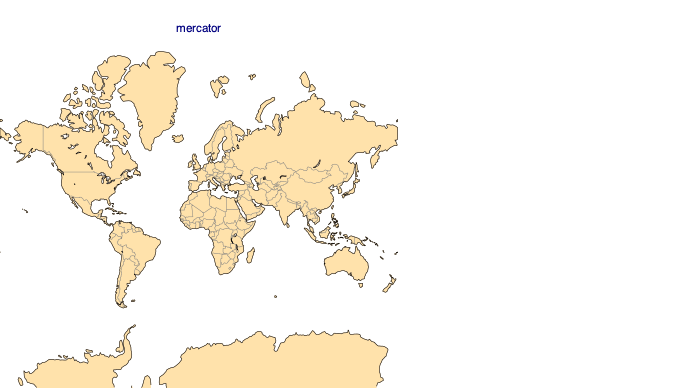
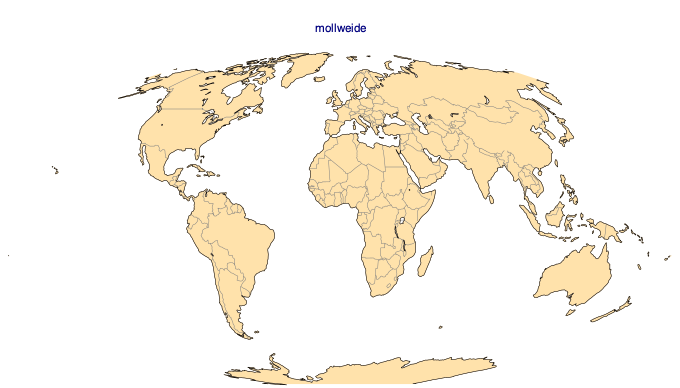
Projections
[11]:
from climetlab.plotting import projections
[12]:
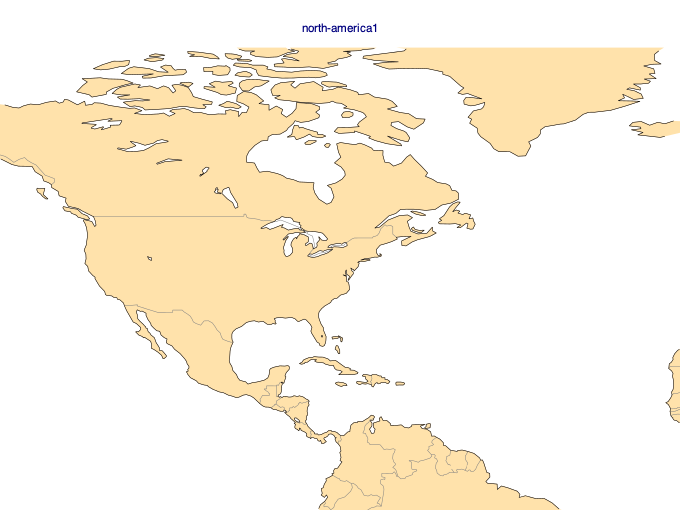
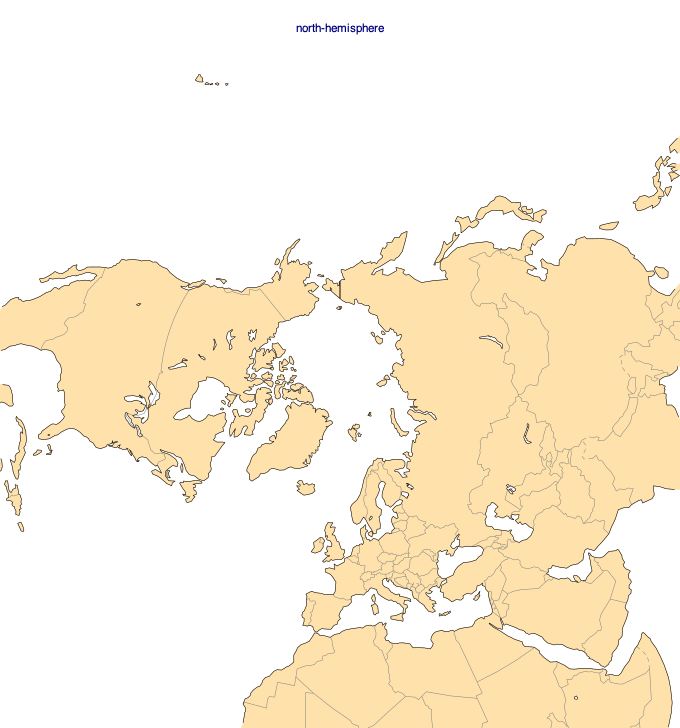
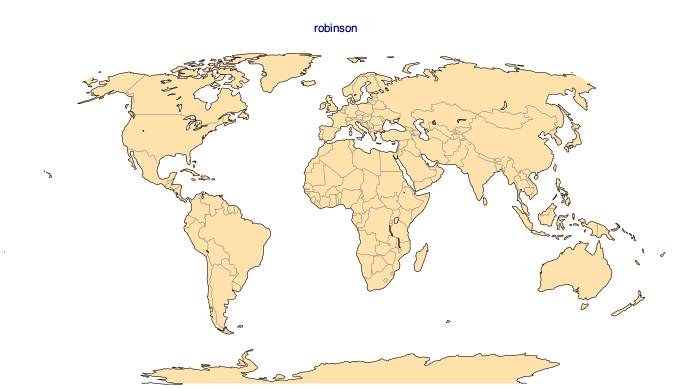
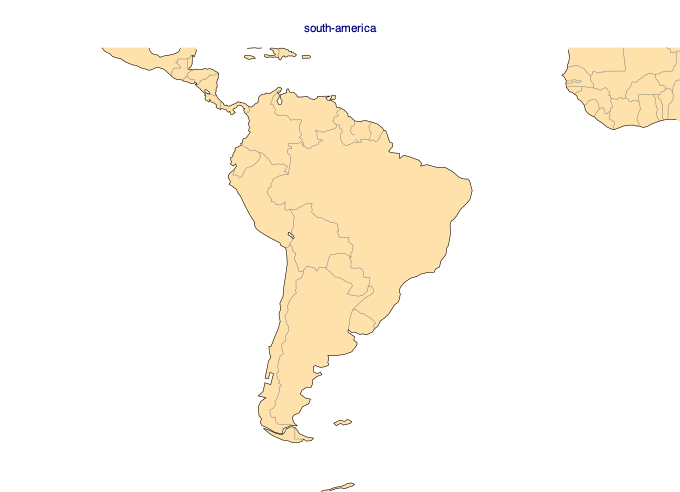
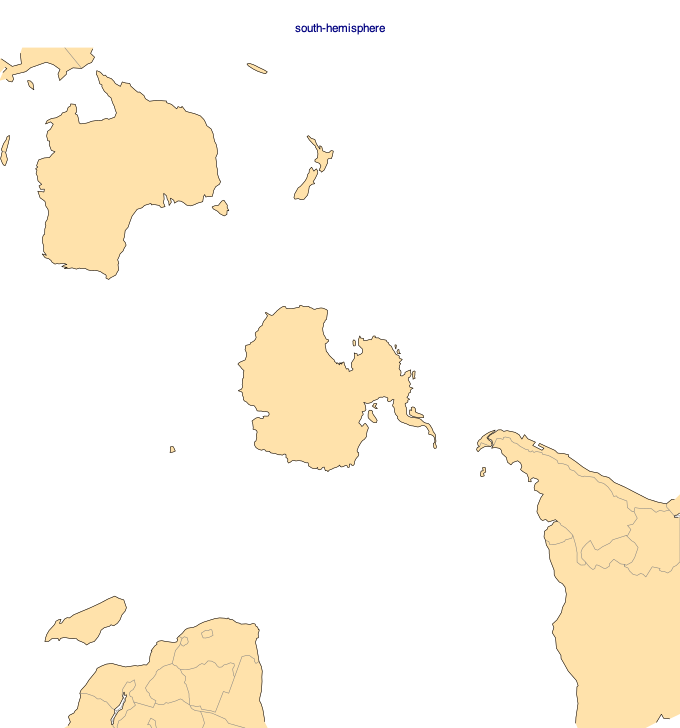
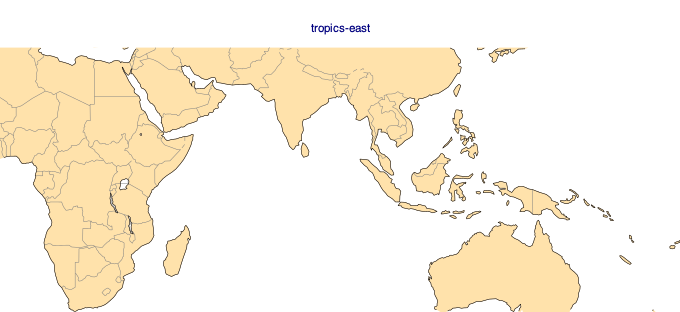
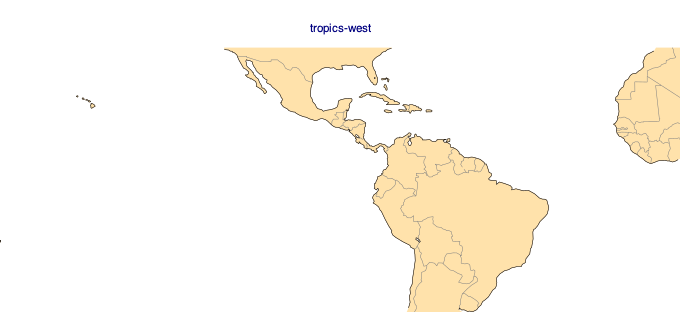
for projection in projections():
    cml.plot_map(projection=projection, title=projection)


Low-level graphical attributes
[13]:
cml.plotting_options(width=500)
[14]:
atlantic = cml.load_dataset("hurricane-database", bassin="atlantic")
[15]:
df = atlantic.to_pandas()
[16]:
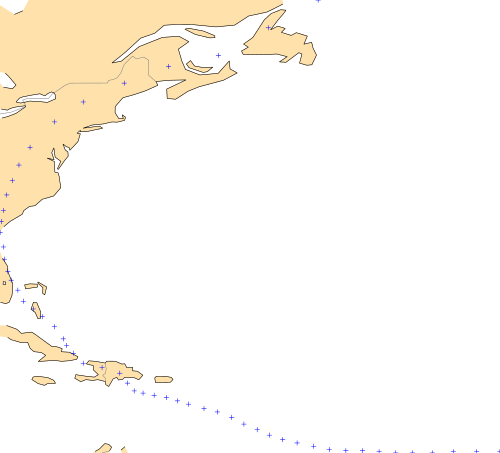
david = df[(df.name == "david")]
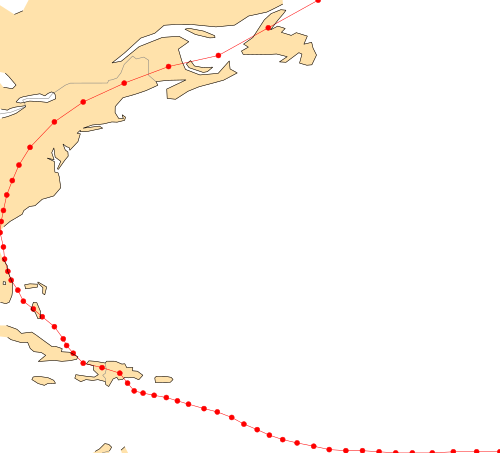
[17]:
cml.plot_map(
    david, style=dict(symbol_colour="blue", symbol_type="marker", symbol_marker_index=3)
)
[18]:
cml.plot_map(david)
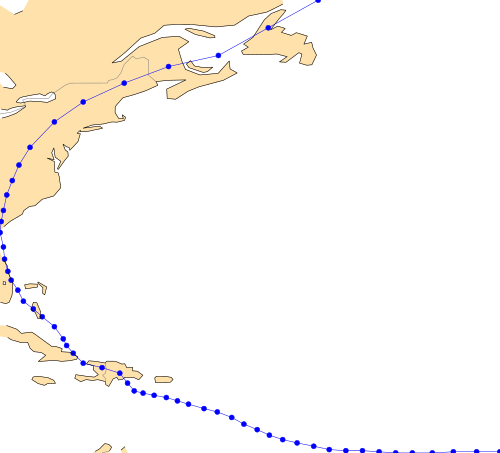
[19]:
cml.plot_map(david, style={"+symbol_colour": "blue"})
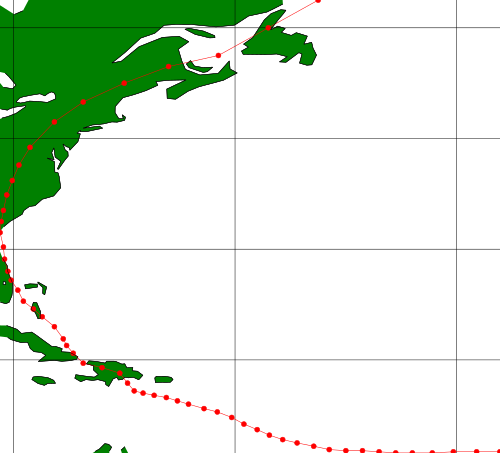
[20]:
cml.plot_map(
    david,
    background={
        "map_coastline_land_shade": True,
        "map_coastline_land_shade_colour": "green",
    },
)
[21]:
cml.plot_map(david, background=False)