You can run this notebook in ![]() , in
, in ![]() , in
, in ![]() or in
or in  .
.
[1]:
!pip install --quiet climetlab matplotlib
ERA5-based datasets
[2]:
import numpy as np
import matplotlib.pyplot as plt
[3]:
import climetlab as cml
[4]:
cml.plotting_options(width=400)
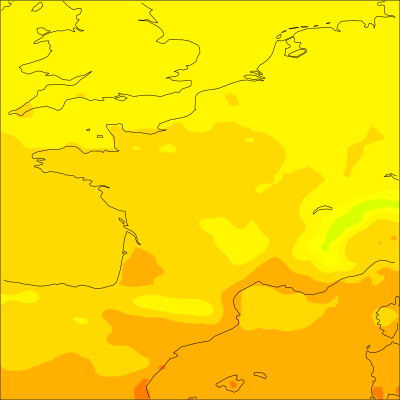
Surface temperature in France
[5]:
ds = cml.load_dataset("era5-temperature", period=(1979, 1982), domain="France", time=12)
[6]:
%%time
len(ds)
CPU times: user 558 ms, sys: 94.9 ms, total: 653 ms
Wall time: 686 ms
[6]:
1461
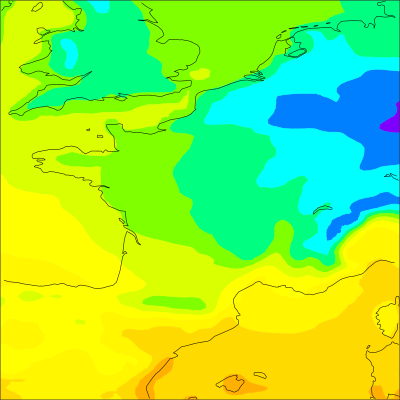
[7]:
cml.plot_map(ds[-1])

[8]:
%%time
ds.to_numpy().shape
CPU times: user 603 ms, sys: 124 ms, total: 727 ms
Wall time: 739 ms
[8]:
(1461, 63, 63)
[9]:
average = np.mean(ds.to_numpy(), axis=0)
[10]:
average
[10]:
array([[283.75848794, 283.5668571 , 283.28540925, ..., 283.07590083,
        283.10228607, 283.10129547],
       [283.4987798 , 283.60046529, 283.65712864, ..., 283.17566394,
        283.24349259, 283.31315138],
       [283.27489098, 282.96305539, 283.02593639, ..., 283.29626172,
        283.42080452, 283.51664   ],
       ...,
       [291.8236389 , 291.01727633, 290.47778203, ..., 292.8580171 ,
        292.87150182, 293.54986986],
       [292.33919705, 292.04851029, 291.94756675, ..., 292.50002974,
        292.48287807, 294.12919668],
       [292.80611291, 292.51362676, 292.36608895, ..., 292.37801758,
        292.20149706, 292.06164609]])
[11]:
cml.plot_map(average, metadata=ds[0])
[12]:
x = ds.to_xarray()
[13]:
x
[13]:
<xarray.Dataset>
Dimensions:     (latitude: 63, longitude: 63, time: 1461)
Coordinates:
  * time        (time) datetime64[ns] 1979-01-01T12:00:00 ... 1982-12-31T12:0...
    number      int64 0
    step        timedelta64[ns] 00:00:00
    surface     int64 0
  * latitude    (latitude) float64 54.5 54.25 54.0 53.75 ... 39.5 39.25 39.0
  * longitude   (longitude) float64 -6.0 -5.75 -5.5 -5.25 ... 8.75 9.0 9.25 9.5
    valid_time  (time) datetime64[ns] 1979-01-01T12:00:00 ... 1982-12-31T12:0...
Data variables:
    t2m         (time, latitude, longitude) float32 269.13837 ... 285.14648
xarray.Dataset
- latitude: 63
- longitude: 63
- time: 1461
- time(time)datetime64[ns]1979-01-01T12:00:00 ... 1982-12-...
- long_name :
- initial time of forecast
- standard_name :
- forecast_reference_time
array(['1979-01-01T12:00:00.000000000', '1979-01-02T12:00:00.000000000', '1979-01-03T12:00:00.000000000', ..., '1982-12-29T12:00:00.000000000', '1982-12-30T12:00:00.000000000', '1982-12-31T12:00:00.000000000'], dtype='datetime64[ns]') - number()int640
- long_name :
- ensemble member numerical id
- units :
- 1
- standard_name :
- realization
array(0)
- step()timedelta64[ns]00:00:00
- long_name :
- time since forecast_reference_time
- standard_name :
- forecast_period
array(0, dtype='timedelta64[ns]')
- surface()int640
- long_name :
- original GRIB coordinate for key: level(surface)
- units :
- 1
array(0)
- latitude(latitude)float6454.5 54.25 54.0 ... 39.5 39.25 39.0
- units :
- degrees_north
- standard_name :
- latitude
- long_name :
- latitude
- stored_direction :
- decreasing
array([54.5 , 54.25, 54. , 53.75, 53.5 , 53.25, 53. , 52.75, 52.5 , 52.25, 52. , 51.75, 51.5 , 51.25, 51. , 50.75, 50.5 , 50.25, 50. , 49.75, 49.5 , 49.25, 49. , 48.75, 48.5 , 48.25, 48. , 47.75, 47.5 , 47.25, 47. , 46.75, 46.5 , 46.25, 46. , 45.75, 45.5 , 45.25, 45. , 44.75, 44.5 , 44.25, 44. , 43.75, 43.5 , 43.25, 43. , 42.75, 42.5 , 42.25, 42. , 41.75, 41.5 , 41.25, 41. , 40.75, 40.5 , 40.25, 40. , 39.75, 39.5 , 39.25, 39. ]) - longitude(longitude)float64-6.0 -5.75 -5.5 ... 9.0 9.25 9.5
- units :
- degrees_east
- standard_name :
- longitude
- long_name :
- longitude
array([-6. , -5.75, -5.5 , -5.25, -5. , -4.75, -4.5 , -4.25, -4. , -3.75, -3.5 , -3.25, -3. , -2.75, -2.5 , -2.25, -2. , -1.75, -1.5 , -1.25, -1. , -0.75, -0.5 , -0.25, 0. , 0.25, 0.5 , 0.75, 1. , 1.25, 1.5 , 1.75, 2. , 2.25, 2.5 , 2.75, 3. , 3.25, 3.5 , 3.75, 4. , 4.25, 4.5 , 4.75, 5. , 5.25, 5.5 , 5.75, 6. , 6.25, 6.5 , 6.75, 7. , 7.25, 7.5 , 7.75, 8. , 8.25, 8.5 , 8.75, 9. , 9.25, 9.5 ]) - valid_time(time)datetime64[ns]1979-01-01T12:00:00 ... 1982-12-...
- standard_name :
- time
- long_name :
- time
array(['1979-01-01T12:00:00.000000000', '1979-01-02T12:00:00.000000000',
       '1979-01-03T12:00:00.000000000', ...,
       '1982-12-29T12:00:00.000000000', '1982-12-30T12:00:00.000000000',
       '1982-12-31T12:00:00.000000000'], dtype='datetime64[ns]')
- t2m(time, latitude, longitude)float32269.13837 270.71063 ... 285.14648
- GRIB_paramId :
- 167
- GRIB_shortName :
- 2t
- GRIB_units :
- K
- GRIB_name :
- 2 metre temperature
- GRIB_cfVarName :
- t2m
- GRIB_dataType :
- an
- GRIB_missingValue :
- 9999
- GRIB_numberOfPoints :
- 3969
- GRIB_totalNumber :
- 0
- GRIB_typeOfLevel :
- surface
- GRIB_NV :
- 0
- GRIB_stepUnits :
- 1
- GRIB_stepType :
- instant
- GRIB_gridType :
- regular_ll
- GRIB_gridDefinitionDescription :
- Latitude/Longitude Grid
- GRIB_Nx :
- 63
- GRIB_iDirectionIncrementInDegrees :
- 0.25
- GRIB_iScansNegatively :
- 0
- GRIB_longitudeOfFirstGridPointInDegrees :
- -6.0
- GRIB_longitudeOfLastGridPointInDegrees :
- 9.5
- GRIB_Ny :
- 63
- GRIB_jDirectionIncrementInDegrees :
- 0.25
- GRIB_jPointsAreConsecutive :
- 0
- GRIB_jScansPositively :
- 0
- GRIB_latitudeOfFirstGridPointInDegrees :
- 54.5
- GRIB_latitudeOfLastGridPointInDegrees :
- 39.0
- long_name :
- 2 metre temperature
- units :
- K
array([[[269.13837, 270.71063, 272.27313, ..., 265.1286 , 265.35516,
         265.8864 ],
        [269.98016, 271.54266, 272.87665, ..., 265.154  , 265.40594,
         265.85907],
        [271.20087, 273.4079 , 274.58173, ..., 265.61298, 265.7829 ,
         266.11688],
        ...,
        [285.7614 , 284.90985, 284.29266, ..., 288.68134, 288.3376 ,
         288.6872 ],
        [286.04462, 285.7204 , 285.43134, ..., 288.67743, 288.8493 ,
         290.18915],
        [285.94305, 286.04852, 285.80048, ..., 289.16962, 289.26923,
         289.26532]],

       [[272.1317 , 273.3661 , 274.37585, ..., 266.8036 , 266.10437,
         265.88757],
        [272.77234, 274.01062, 275.1493 , ..., 267.14343, 266.2079 ,
         265.61414],
        [273.59656, 275.16882, 276.24304, ..., 267.62   , 266.97742,
         266.03796],
...
        [281.3711 , 280.5547 , 279.6953 , ..., 284.76758, 284.5586 ,
         284.48633],
        [281.10156, 281.0078 , 281.0039 , ..., 284.75   , 284.9668 ,
         285.89648],
        [281.14453, 280.96875, 280.91797, ..., 285.3828 , 285.52344,
         285.75   ]],

       [[277.80664, 278.41602, 279.     , ..., 275.84375, 275.53906,
         275.31836],
        [278.09375, 278.72266, 279.49805, ..., 275.23438, 274.98438,
         274.83984],
        [278.4961 , 279.2246 , 279.95703, ..., 274.71484, 274.63477,
         274.50195],
        ...,
        [280.08203, 279.17578, 278.11914, ..., 283.80273, 283.79102,
         284.26562],
        [280.4082 , 279.90234, 279.1172 , ..., 283.9453 , 284.2832 ,
         285.31445],
        [280.8496 , 280.0957 , 279.27344, ..., 284.44922, 284.71875,
         285.14648]]], dtype=float32)
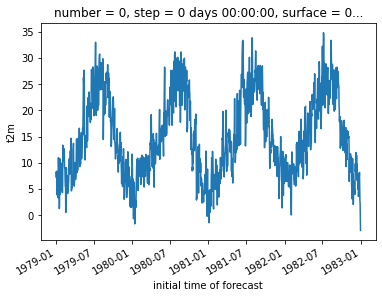
[14]:
point = x.t2m.isel(latitude=50, longitude=5) - 273.15
[15]:
point.plot()
[15]:
[<matplotlib.lines.Line2D at 0x10f788130>]
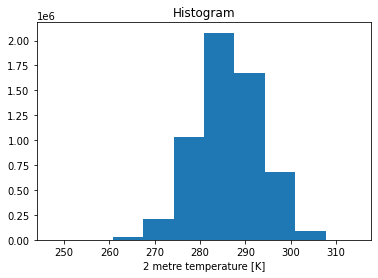
[16]:
x.t2m.plot()
[16]:
(array([6.200000e+01, 1.715000e+03, 2.437000e+04, 2.066870e+05,
        1.035682e+06, 2.078559e+06, 1.673685e+06, 6.841460e+05,
        9.120900e+04, 2.594000e+03]),
 array([247.29189, 254.00276, 260.71362, 267.4245 , 274.13538, 280.84625,
        287.55713, 294.268  , 300.97888, 307.68976, 314.40063],
       dtype=float32),
 <BarContainer object of 10 artists>)
[17]:
cml.plot_map(x)
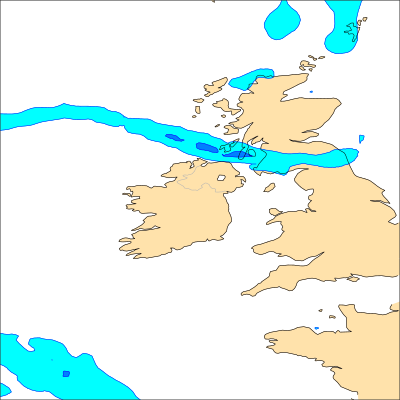
Precipitations from Ireland
[18]:
ds = cml.load_dataset(
    "era5-precipitations", period=(1979, 1982), domain="Ireland", time=12
)
[19]:
cml.plot_map(ds[0])