You can run this notebook in ![]() , in
, in ![]() , in
, in ![]() or in
or in  .
.
[1]:
# !pip install --quiet climetlab
Meteonet
This is an retrieve an plot various data types from https://github.com/meteofrance/meteonet
[2]:
import climetlab as cml
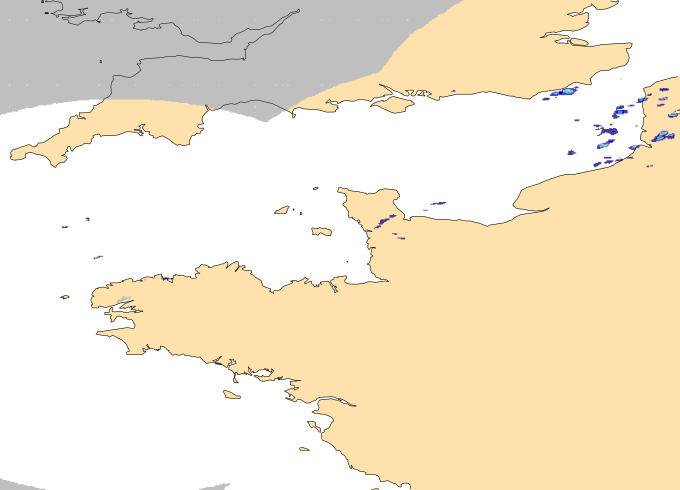
Radar images
[3]:
ds = cml.load_dataset("meteonet-samples-radar")
[4]:
ds
[4]:
meteonet-samples-radar
| Home page | https://meteonet.umr-cnrm.fr |
| Documentation | https://meteofrance.github.io/meteonet/ |
| Citation | - |
| Licence | https://meteonet.umr-cnrm.fr/dataset/LICENCE.md |
[5]:
ds.licence
[5]:
'https://meteonet.umr-cnrm.fr/dataset/LICENCE.md'
[6]:
cml.plot_map(ds)
/Users/baudouin/git/climetlab/climetlab/normalize.py:17: UserWarning: Deprecated decorator @normalize_arg. Use @normalise on each argument instead.
  warnings.warn(
[7]:
ds.to_xarray()
[7]:
<xarray.Dataset>
Dimensions:   (time: 45, y: 565, x: 784)
Coordinates:
  * x         (x) int64 0 1 2 3 4 5 6 7 8 ... 776 777 778 779 780 781 782 783
  * y         (y) int64 0 1 2 3 4 5 6 7 8 ... 557 558 559 560 561 562 563 564
    lon       (y, x) float64 -5.832 -5.822 -5.812 -5.802 ... 1.978 1.988 1.998
    lat       (y, x) float64 51.89 51.89 51.89 51.89 ... 46.25 46.25 46.25 46.25
  * time      (time) datetime64[ns] 2016-08-21T00:10:00 ... 2016-08-31T00:30:00
Data variables:
    rainfall  (time, y, x) int16 -1 -1 -1 -1 -1 -1 -1 -1 -1 ... 0 0 0 0 0 0 0 0
xarray.Dataset
- time: 45
- y: 565
- x: 784
- x(x)int640 1 2 3 4 5 ... 779 780 781 782 783
- axis :
- X
array([ 0, 1, 2, ..., 781, 782, 783])
- y(y)int640 1 2 3 4 5 ... 560 561 562 563 564
- axis :
- Y
array([ 0, 1, 2, ..., 562, 563, 564])
- lon(y, x)float64-5.832 -5.822 ... 1.988 1.998
- standard_name :
- longitude
array([[-5.832, -5.822, -5.812, ..., 1.978, 1.988, 1.998], [-5.832, -5.822, -5.812, ..., 1.978, 1.988, 1.998], [-5.832, -5.822, -5.812, ..., 1.978, 1.988, 1.998], ..., [-5.832, -5.822, -5.812, ..., 1.978, 1.988, 1.998], [-5.832, -5.822, -5.812, ..., 1.978, 1.988, 1.998], [-5.832, -5.822, -5.812, ..., 1.978, 1.988, 1.998]]) - lat(y, x)float6451.89 51.89 51.89 ... 46.25 46.25
- standard_name :
- latitude
array([[51.886, 51.886, 51.886, ..., 51.886, 51.886, 51.886], [51.876, 51.876, 51.876, ..., 51.876, 51.876, 51.876], [51.866, 51.866, 51.866, ..., 51.866, 51.866, 51.866], ..., [46.266, 46.266, 46.266, ..., 46.266, 46.266, 46.266], [46.256, 46.256, 46.256, ..., 46.256, 46.256, 46.256], [46.246, 46.246, 46.246, ..., 46.246, 46.246, 46.246]]) - time(time)datetime64[ns]2016-08-21T00:10:00 ... 2016-08-...
- standard_name :
- time
array(['2016-08-21T00:10:00.000000000', '2016-08-21T00:55:00.000000000',
       '2016-08-21T01:00:00.000000000', '2016-08-21T01:10:00.000000000',
       '2016-08-21T01:25:00.000000000', '2016-08-21T01:30:00.000000000',
       '2016-08-21T01:35:00.000000000', '2016-08-28T10:00:00.000000000',
       '2016-08-28T10:05:00.000000000', '2016-08-28T10:10:00.000000000',
       '2016-08-28T10:15:00.000000000', '2016-08-28T10:20:00.000000000',
       '2016-08-28T10:25:00.000000000', '2016-08-28T10:30:00.000000000',
       '2016-08-28T10:35:00.000000000', '2016-08-28T10:40:00.000000000',
       '2016-08-28T10:45:00.000000000', '2016-08-28T10:50:00.000000000',
       '2016-08-28T10:55:00.000000000', '2016-08-28T11:00:00.000000000',
       '2016-08-28T11:05:00.000000000', '2016-08-28T11:10:00.000000000',
       '2016-08-28T11:40:00.000000000', '2016-08-28T11:45:00.000000000',
       '2016-08-28T11:55:00.000000000', '2016-08-28T13:00:00.000000000',
       '2016-08-28T13:05:00.000000000', '2016-08-28T13:10:00.000000000',
       '2016-08-28T13:15:00.000000000', '2016-08-28T13:20:00.000000000',
       '2016-08-28T13:25:00.000000000', '2016-08-28T13:30:00.000000000',
       '2016-08-28T13:35:00.000000000', '2016-08-28T13:40:00.000000000',
       '2016-08-28T13:45:00.000000000', '2016-08-28T13:50:00.000000000',
       '2016-08-28T13:55:00.000000000', '2016-08-30T23:45:00.000000000',
       '2016-08-30T23:50:00.000000000', '2016-08-30T23:55:00.000000000',
       '2016-08-31T00:00:00.000000000', '2016-08-31T00:05:00.000000000',
       '2016-08-31T00:20:00.000000000', '2016-08-31T00:25:00.000000000',
       '2016-08-31T00:30:00.000000000'], dtype='datetime64[ns]')
- rainfall(time, y, x)int16-1 -1 -1 -1 -1 -1 ... 0 0 0 0 0 0
array([[[-1, -1, -1, ...,  0,  0,  0],
        [-1, -1, -1, ...,  0,  0,  0],
        [-1, -1, -1, ...,  0,  0,  0],
        ...,
        [-1, -1, -1, ...,  0,  0,  0],
        [-1, -1, -1, ...,  0,  0,  0],
        [-1, -1, -1, ...,  0,  0,  0]],

       [[-1, -1, -1, ...,  0,  0,  0],
        [-1, -1, -1, ...,  0,  0,  0],
        [-1, -1, -1, ...,  0,  0,  0],
        ...,
        [-1, -1, -1, ...,  0,  0,  0],
        [-1, -1, -1, ...,  0,  0,  0],
        [-1, -1, -1, ...,  0,  0,  0]],

       [[-1, -1, -1, ...,  0,  0,  0],
        [-1, -1, -1, ...,  0,  0,  0],
        [-1, -1, -1, ...,  0,  0,  0],
        ...,
...
        ...,
        [-1, -1, -1, ...,  0,  0,  0],
        [-1, -1, -1, ...,  0,  0,  0],
        [-1, -1, -1, ...,  0,  0,  0]],

       [[-1, -1, -1, ...,  0,  0,  0],
        [-1, -1, -1, ...,  0,  0,  0],
        [-1, -1, -1, ...,  0,  0,  0],
        ...,
        [-1, -1, -1, ...,  0,  0,  0],
        [-1, -1, -1, ...,  0,  0,  0],
        [-1, -1, -1, ...,  0,  0,  0]],

       [[-1, -1, -1, ...,  0,  0,  0],
        [-1, -1, -1, ...,  0,  0,  0],
        [-1, -1, -1, ...,  0,  0,  0],
        ...,
        [-1, -1, -1, ...,  0,  0,  0],
        [-1, -1, -1, ...,  0,  0,  0],
        [-1, -1, -1, ...,  0,  0,  0]]], dtype=int16)
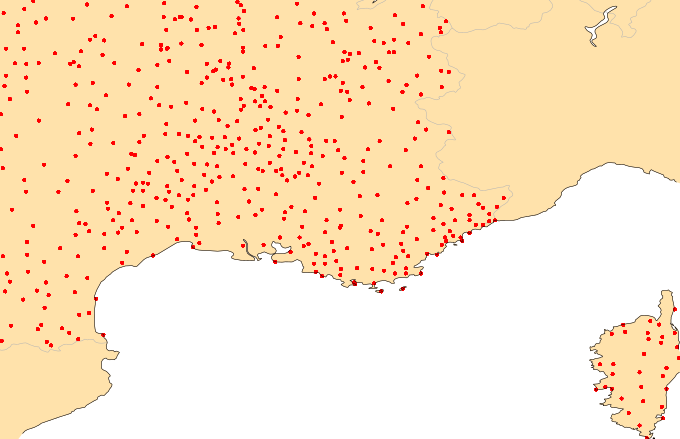
Ground station observations
[8]:
ds = cml.load_dataset("meteonet-samples-ground-stations", domain="SE")
[9]:
ds.to_pandas()
[9]:
| number_sta | lat | lon | height_sta | date | dd | ff | precip | hu | td | t | psl | |
|---|---|---|---|---|---|---|---|---|---|---|---|---|
| 0 | 1027003 | 45.83000 | 5.11000 | 196.0 | 2016-01-01 00:00:00 | NaN | NaN | NaN | 98.0 | 278.75 | 279.05 | NaN |
| 1 | 1033002 | 46.09000 | 5.81000 | 350.0 | 2016-01-01 00:00:00 | 0.0 | 0.0 | 0.0 | 99.0 | 278.25 | 278.35 | NaN |
| 2 | 1034004 | 45.77000 | 5.69000 | 330.0 | 2016-01-01 00:00:00 | 0.0 | 0.0 | 0.0 | 100.0 | 279.15 | 279.15 | NaN |
| 3 | 1072001 | 46.20000 | 5.29000 | 260.0 | 2016-01-01 00:00:00 | NaN | NaN | 0.0 | NaN | NaN | 276.55 | NaN |
| 4 | 1089001 | 45.98000 | 5.33000 | 252.0 | 2016-01-01 00:00:00 | 0.0 | 0.0 | 0.0 | 95.0 | 278.85 | 279.55 | 102720.0 |
| ... | ... | ... | ... | ... | ... | ... | ... | ... | ... | ... | ... | ... |
| 111618 | 84085004 | 43.94000 | 5.23000 | 488.0 | 2016-01-01 23:54:00 | 100.0 | 2.0 | 0.0 | 94.0 | 280.05 | 280.95 | NaN |
| 111619 | 84086001 | 43.81000 | 5.15000 | 672.0 | 2016-01-01 23:54:00 | 140.0 | 7.6 | 0.0 | 93.0 | 279.65 | 280.75 | NaN |
| 111620 | 84087001 | 44.14000 | 4.86000 | 55.0 | 2016-01-01 23:54:00 | 130.0 | 5.0 | 0.0 | 76.0 | 281.25 | 285.35 | 101760.0 |
| 111621 | 84107002 | 44.04067 | 5.49283 | 836.0 | 2016-01-01 23:54:00 | 120.0 | 3.8 | 0.2 | 99.0 | 278.55 | 278.65 | NaN |
| 111622 | 84150001 | 44.34000 | 4.91000 | 141.0 | 2016-01-01 23:54:00 | 110.0 | 3.1 | 0.0 | 82.0 | 281.85 | 284.85 | NaN |
111623 rows × 12 columns
[10]:
cml.plot_map(ds)
Weather models
[11]:
ds = cml.load_dataset("meteonet-samples-weather-models", model="arome")
[12]:
ds.to_xarray()
[12]:
<xarray.Dataset>
Dimensions:            (time: 1, step: 25, heightAboveGround: 1, latitude: 227, longitude: 315)
Coordinates:
  * time               (time) datetime64[ns] 2018-05-01
  * step               (step) timedelta64[ns] 00:00:00 ... 1 days 00:00:00
  * heightAboveGround  (heightAboveGround) int64 2
  * latitude           (latitude) float64 51.9 51.87 51.85 ... 46.3 46.27 46.25
  * longitude          (longitude) float64 -5.842 -5.817 -5.792 ... 1.983 2.008
    valid_time         (time, step) datetime64[ns] dask.array<chunksize=(1, 25), meta=np.ndarray>
Data variables:
    t2m                (time, step, heightAboveGround, latitude, longitude) float32 dask.array<chunksize=(1, 25, 1, 227, 315), meta=np.ndarray>
    d2m                (time, step, heightAboveGround, latitude, longitude) float32 dask.array<chunksize=(1, 25, 1, 227, 315), meta=np.ndarray>
    r                  (time, step, heightAboveGround, latitude, longitude) float32 dask.array<chunksize=(1, 25, 1, 227, 315), meta=np.ndarray>
Attributes:
    GRIB_edition:            1
    GRIB_centre:             lfpw
    GRIB_centreDescription:  French Weather Service - Toulouse
    GRIB_subCentre:          0
    Conventions:             CF-1.7
    institution:             French Weather Service - Toulouse
    history:                 2021-11-13T18:08:50 GRIB to CDM+CF via cfgrib-0....
xarray.Dataset
- time: 1
- step: 25
- heightAboveGround: 1
- latitude: 227
- longitude: 315
- time(time)datetime64[ns]2018-05-01
- long_name :
- initial time of forecast
- standard_name :
- forecast_reference_time
array(['2018-05-01T00:00:00.000000000'], dtype='datetime64[ns]')
- step(step)timedelta64[ns]00:00:00 ... 1 days 00:00:00
- long_name :
- time since forecast_reference_time
- standard_name :
- forecast_period
array([ 0, 3600000000000, 7200000000000, 10800000000000, 14400000000000, 18000000000000, 21600000000000, 25200000000000, 28800000000000, 32400000000000, 36000000000000, 39600000000000, 43200000000000, 46800000000000, 50400000000000, 54000000000000, 57600000000000, 61200000000000, 64800000000000, 68400000000000, 72000000000000, 75600000000000, 79200000000000, 82800000000000, 86400000000000], dtype='timedelta64[ns]') - heightAboveGround(heightAboveGround)int642
- long_name :
- height above the surface
- units :
- m
- positive :
- up
- standard_name :
- height
array([2])
- latitude(latitude)float6451.9 51.87 51.85 ... 46.27 46.25
- units :
- degrees_north
- standard_name :
- latitude
- long_name :
- latitude
- stored_direction :
- decreasing
array([51.896, 51.871, 51.846, ..., 46.296, 46.271, 46.246])
- longitude(longitude)float64-5.842 -5.817 ... 1.983 2.008
- units :
- degrees_east
- standard_name :
- longitude
- long_name :
- longitude
array([-5.842, -5.817, -5.792, ..., 1.958, 1.983, 2.008])
- valid_time(time, step)datetime64[ns]dask.array<chunksize=(1, 25), meta=np.ndarray>
- standard_name :
- time
- long_name :
- time
Array Chunk Bytes 200 B 200 B Shape (1, 25) (1, 25) Count 2 Tasks 1 Chunks Type datetime64[ns] numpy.ndarray
- t2m(time, step, heightAboveGround, latitude, longitude)float32dask.array<chunksize=(1, 25, 1, 227, 315), meta=np.ndarray>
- GRIB_paramId :
- 167
- GRIB_shortName :
- 2t
- GRIB_units :
- K
- GRIB_name :
- 2 metre temperature
- GRIB_cfName :
- air_temperature
- GRIB_cfVarName :
- t2m
- GRIB_missingValue :
- 9999
- GRIB_numberOfPoints :
- 71505
- GRIB_typeOfLevel :
- heightAboveGround
- GRIB_NV :
- 0
- GRIB_stepUnits :
- 1
- GRIB_stepType :
- instant
- GRIB_gridType :
- regular_ll
- GRIB_gridDefinitionDescription :
- Latitude/Longitude Grid
- GRIB_Nx :
- 315
- GRIB_iDirectionIncrementInDegrees :
- 0.025
- GRIB_iScansNegatively :
- 0
- GRIB_longitudeOfFirstGridPointInDegrees :
- -5.842
- GRIB_longitudeOfLastGridPointInDegrees :
- 2.008
- GRIB_Ny :
- 227
- GRIB_jDirectionIncrementInDegrees :
- 0.025
- GRIB_jPointsAreConsecutive :
- 0
- GRIB_jScansPositively :
- 0
- GRIB_latitudeOfFirstGridPointInDegrees :
- 51.896
- GRIB_latitudeOfLastGridPointInDegrees :
- 46.246
- long_name :
- 2 metre temperature
- units :
- K
- standard_name :
- air_temperature
Array Chunk Bytes 7.15 MB 7.15 MB Shape (1, 25, 1, 227, 315) (1, 25, 1, 227, 315) Count 2 Tasks 1 Chunks Type float32 numpy.ndarray - d2m(time, step, heightAboveGround, latitude, longitude)float32dask.array<chunksize=(1, 25, 1, 227, 315), meta=np.ndarray>
- GRIB_paramId :
- 168
- GRIB_shortName :
- 2d
- GRIB_units :
- K
- GRIB_name :
- 2 metre dewpoint temperature
- GRIB_cfVarName :
- d2m
- GRIB_missingValue :
- 9999
- GRIB_numberOfPoints :
- 71505
- GRIB_typeOfLevel :
- heightAboveGround
- GRIB_NV :
- 0
- GRIB_stepUnits :
- 1
- GRIB_stepType :
- instant
- GRIB_gridType :
- regular_ll
- GRIB_gridDefinitionDescription :
- Latitude/Longitude Grid
- GRIB_Nx :
- 315
- GRIB_iDirectionIncrementInDegrees :
- 0.025
- GRIB_iScansNegatively :
- 0
- GRIB_longitudeOfFirstGridPointInDegrees :
- -5.842
- GRIB_longitudeOfLastGridPointInDegrees :
- 2.008
- GRIB_Ny :
- 227
- GRIB_jDirectionIncrementInDegrees :
- 0.025
- GRIB_jPointsAreConsecutive :
- 0
- GRIB_jScansPositively :
- 0
- GRIB_latitudeOfFirstGridPointInDegrees :
- 51.896
- GRIB_latitudeOfLastGridPointInDegrees :
- 46.246
- long_name :
- 2 metre dewpoint temperature
- units :
- K
Array Chunk Bytes 7.15 MB 7.15 MB Shape (1, 25, 1, 227, 315) (1, 25, 1, 227, 315) Count 2 Tasks 1 Chunks Type float32 numpy.ndarray - r(time, step, heightAboveGround, latitude, longitude)float32dask.array<chunksize=(1, 25, 1, 227, 315), meta=np.ndarray>
- GRIB_paramId :
- 157
- GRIB_shortName :
- r
- GRIB_units :
- %
- GRIB_name :
- Relative humidity
- GRIB_cfName :
- relative_humidity
- GRIB_cfVarName :
- r
- GRIB_missingValue :
- 9999
- GRIB_numberOfPoints :
- 71505
- GRIB_typeOfLevel :
- heightAboveGround
- GRIB_NV :
- 0
- GRIB_stepUnits :
- 1
- GRIB_stepType :
- instant
- GRIB_gridType :
- regular_ll
- GRIB_gridDefinitionDescription :
- Latitude/Longitude Grid
- GRIB_Nx :
- 315
- GRIB_iDirectionIncrementInDegrees :
- 0.025
- GRIB_iScansNegatively :
- 0
- GRIB_longitudeOfFirstGridPointInDegrees :
- -5.842
- GRIB_longitudeOfLastGridPointInDegrees :
- 2.008
- GRIB_Ny :
- 227
- GRIB_jDirectionIncrementInDegrees :
- 0.025
- GRIB_jPointsAreConsecutive :
- 0
- GRIB_jScansPositively :
- 0
- GRIB_latitudeOfFirstGridPointInDegrees :
- 51.896
- GRIB_latitudeOfLastGridPointInDegrees :
- 46.246
- long_name :
- Relative humidity
- units :
- %
- standard_name :
- relative_humidity
Array Chunk Bytes 7.15 MB 7.15 MB Shape (1, 25, 1, 227, 315) (1, 25, 1, 227, 315) Count 2 Tasks 1 Chunks Type float32 numpy.ndarray
- GRIB_edition :
- 1
- GRIB_centre :
- lfpw
- GRIB_centreDescription :
- French Weather Service - Toulouse
- GRIB_subCentre :
- 0
- Conventions :
- CF-1.7
- institution :
- French Weather Service - Toulouse
- history :
- 2021-11-13T18:08:50 GRIB to CDM+CF via cfgrib-0.9.8.5/ecCodes-2.24.0 with {"source": "/var/folders/gt/_nyhyz497ns5szsvxw16gz6m0000gn/T/climetlab-baudouin/url-255ea7f0843f06cdda0174c5a06fe3fd3b9045229cd6d5bd91c655f428c50fde.grib", "filter_by_keys": {}, "encode_cf": ["parameter", "time", "geography", "vertical"]}
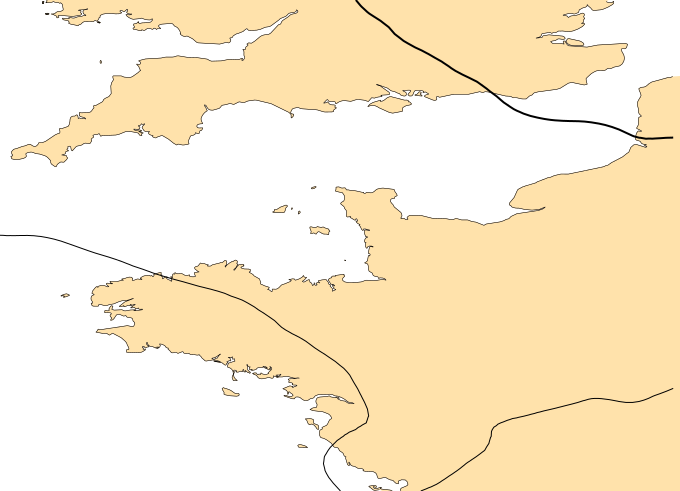
[13]:
ds = cml.load_dataset(
    "meteonet-samples-weather-models", model="arpege", variable="P_sea_level"
)
[14]:
cml.plot_map(ds[0])
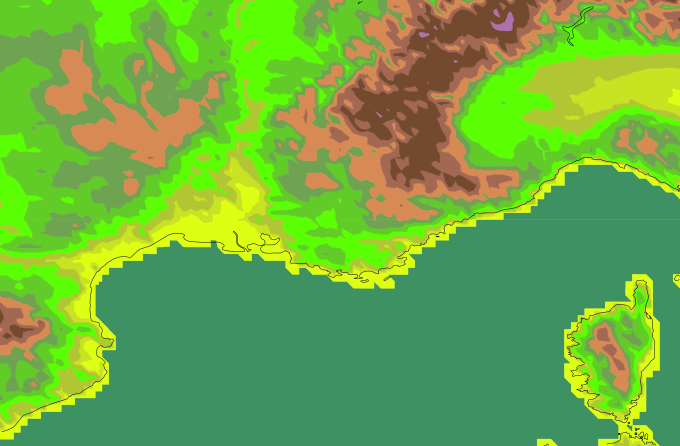
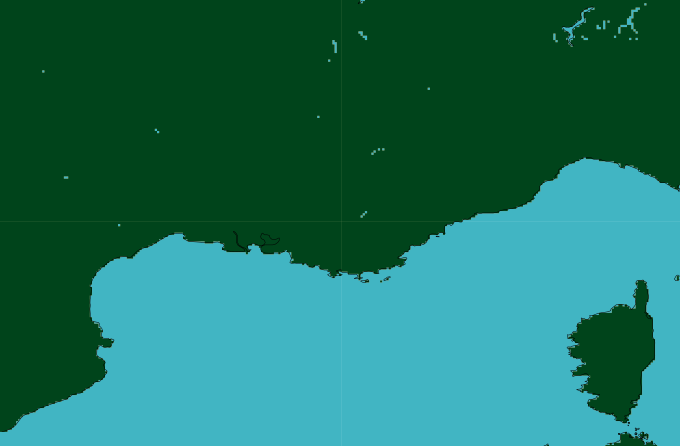
Masks
[15]:
ds = cml.load_dataset("meteonet-samples-masks", domain="SE")
[16]:
cml.plot_map(ds[0])
[17]:
cml.plot_map(ds[1])