You can run this notebook in ![]() , in
, in ![]() , in
, in ![]() or in
or in  .
.
[1]:
!pip install --quiet climetlab climetlab-demo-source climetlab-demo-dataset
External plugins
[2]:
import climetlab as cml
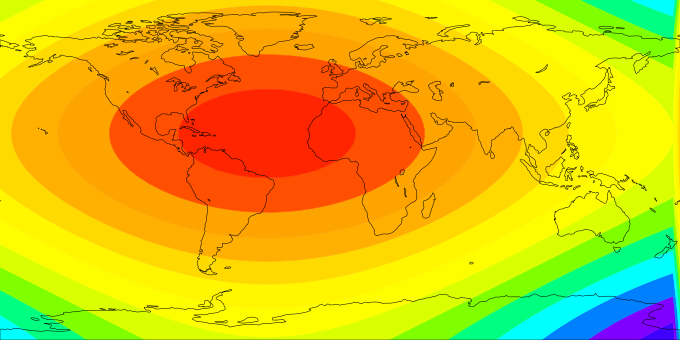
Get the demo dataset:
[3]:
ds = cml.load_dataset("demo-dataset")
Plot it:
[4]:
cml.plot_map(ds)
External data source
[5]:
!test -f test.db || wget https://github.com/ecmwf/climetlab/raw/main/docs/examples/test.db
[6]:
s = cml.load_source(
    "demo-source", "sqlite:///test.db", "select * from data;", parse_dates=["time"]
)
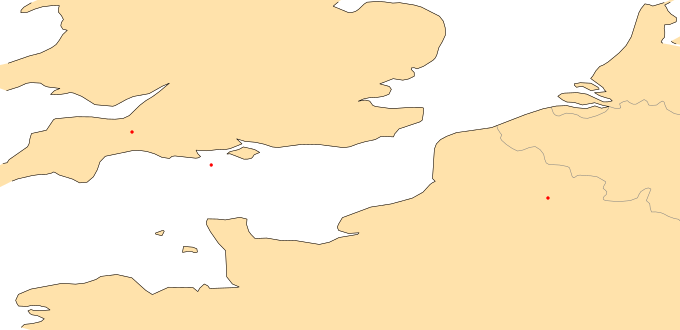
[7]:
df = s.to_pandas()
[8]:
df
[8]:
| lat | lon | time | value | |
|---|---|---|---|---|
| 0 | 50.0 | 3.3 | 2001-01-01 | 4.9 |
| 1 | 51.0 | -3.0 | 2001-01-02 | 7.3 |
| 2 | 50.5 | -1.8 | 2001-01-03 | 5.5 |
[9]:
cml.plot_map(df, margins=2)