You can run this notebook in , in
, in


[1]:
!pip install --quiet climetlab[interactive]
ECMWF Observation bespoke format (ODB)
[2]:
import climetlab as cml
[3]:
source = cml.load_source(
    "mars",
    type="ofb",
    obsgroup="conv",
    time="12",
    format="odb",
    reportype=16001,
    date="2020-05-18",
)
[4]:
pd = source.to_pandas()
[5]:
pd
[5]:
| type | expver | class | stream | andate | antime | reportype | numtsl@desc | timeslot@timeslot_index | seqno@hdr | ... | datum_rdbflag@body | biascorr@body | biascorr_fg@body | qc_pge@body | an_depar@body | fg_depar@body | obs_error@errstat | final_obs_error@errstat | fg_error@errstat | eda_spread@errstat | |
|---|---|---|---|---|---|---|---|---|---|---|---|---|---|---|---|---|---|---|---|---|---|
| 0 | 263 | 0001 | 1 | 1025 | 20200518 | 120000 | 16001 | 17 | 15 | 4443 | ... | 0 | NaN | NaN | NaN | -10.560810 | -14.283884 | 41.155659 | 41.155659 | 25.144444 | 13.044278 |
| 1 | 263 | 0001 | 1 | 1025 | 20200518 | 120000 | 16001 | 17 | 15 | 4443 | ... | 0 | NaN | NaN | NaN | 36.250599 | 34.712360 | 41.155659 | 41.155659 | 25.144444 | 13.044278 |
| 2 | 263 | 0001 | 1 | 1025 | 20200518 | 120000 | 16001 | 17 | 15 | 4443 | ... | 0 | 0.0 | 0.0 | NaN | -9.160848 | -12.384340 | 33.596455 | 33.596455 | 0.260278 | 0.011694 |
| 3 | 263 | 0001 | 1 | 1025 | 20200518 | 120000 | 16001 | 17 | 15 | 4443 | ... | 0 | 0.0 | 0.0 | NaN | NaN | NaN | NaN | NaN | NaN | NaN |
| 4 | 263 | 0001 | 1 | 1025 | 20200518 | 120000 | 16001 | 17 | 15 | 4443 | ... | 0 | 0.0 | 0.0 | NaN | 2.482570 | 2.683633 | 1.408449 | 1.408449 | 0.502528 | 0.395115 |
| ... | ... | ... | ... | ... | ... | ... | ... | ... | ... | ... | ... | ... | ... | ... | ... | ... | ... | ... | ... | ... | ... |
| 410015 | 263 | 0001 | 1 | 1025 | 20200518 | 120000 | 16001 | 17 | 15 | 9133718 | ... | 0 | 0.0 | 0.0 | NaN | NaN | NaN | NaN | NaN | NaN | NaN |
| 410016 | 263 | 0001 | 1 | 1025 | 20200518 | 120000 | 16001 | 17 | 15 | 9133718 | ... | 0 | 0.0 | 0.0 | NaN | NaN | NaN | NaN | NaN | NaN | NaN |
| 410017 | 263 | 0001 | 1 | 1025 | 20200518 | 120000 | 16001 | 17 | 15 | 9133718 | ... | 0 | 0.0 | 0.0 | NaN | NaN | NaN | NaN | NaN | NaN | NaN |
| 410018 | 263 | 0001 | 1 | 1025 | 20200518 | 120000 | 16001 | 17 | 15 | 9133718 | ... | 0 | 0.0 | 0.0 | NaN | NaN | NaN | NaN | NaN | NaN | NaN |
| 410019 | 263 | 0001 | 1 | 1025 | 20200518 | 120000 | 16001 | 17 | 15 | 9133718 | ... | 0 | 0.0 | 0.0 | NaN | NaN | NaN | NaN | NaN | NaN | NaN |
410020 rows × 51 columns
[6]:
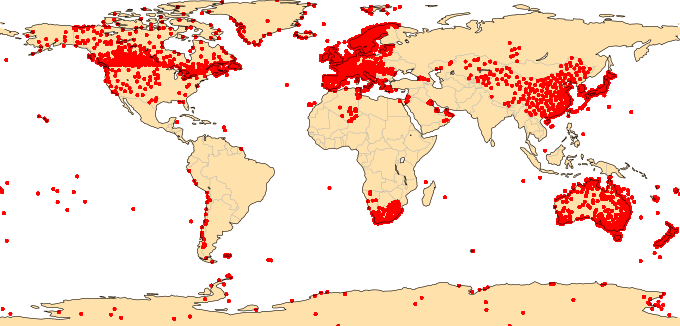
cml.plot_map(pd)
